QUESTION IMAGE
Question
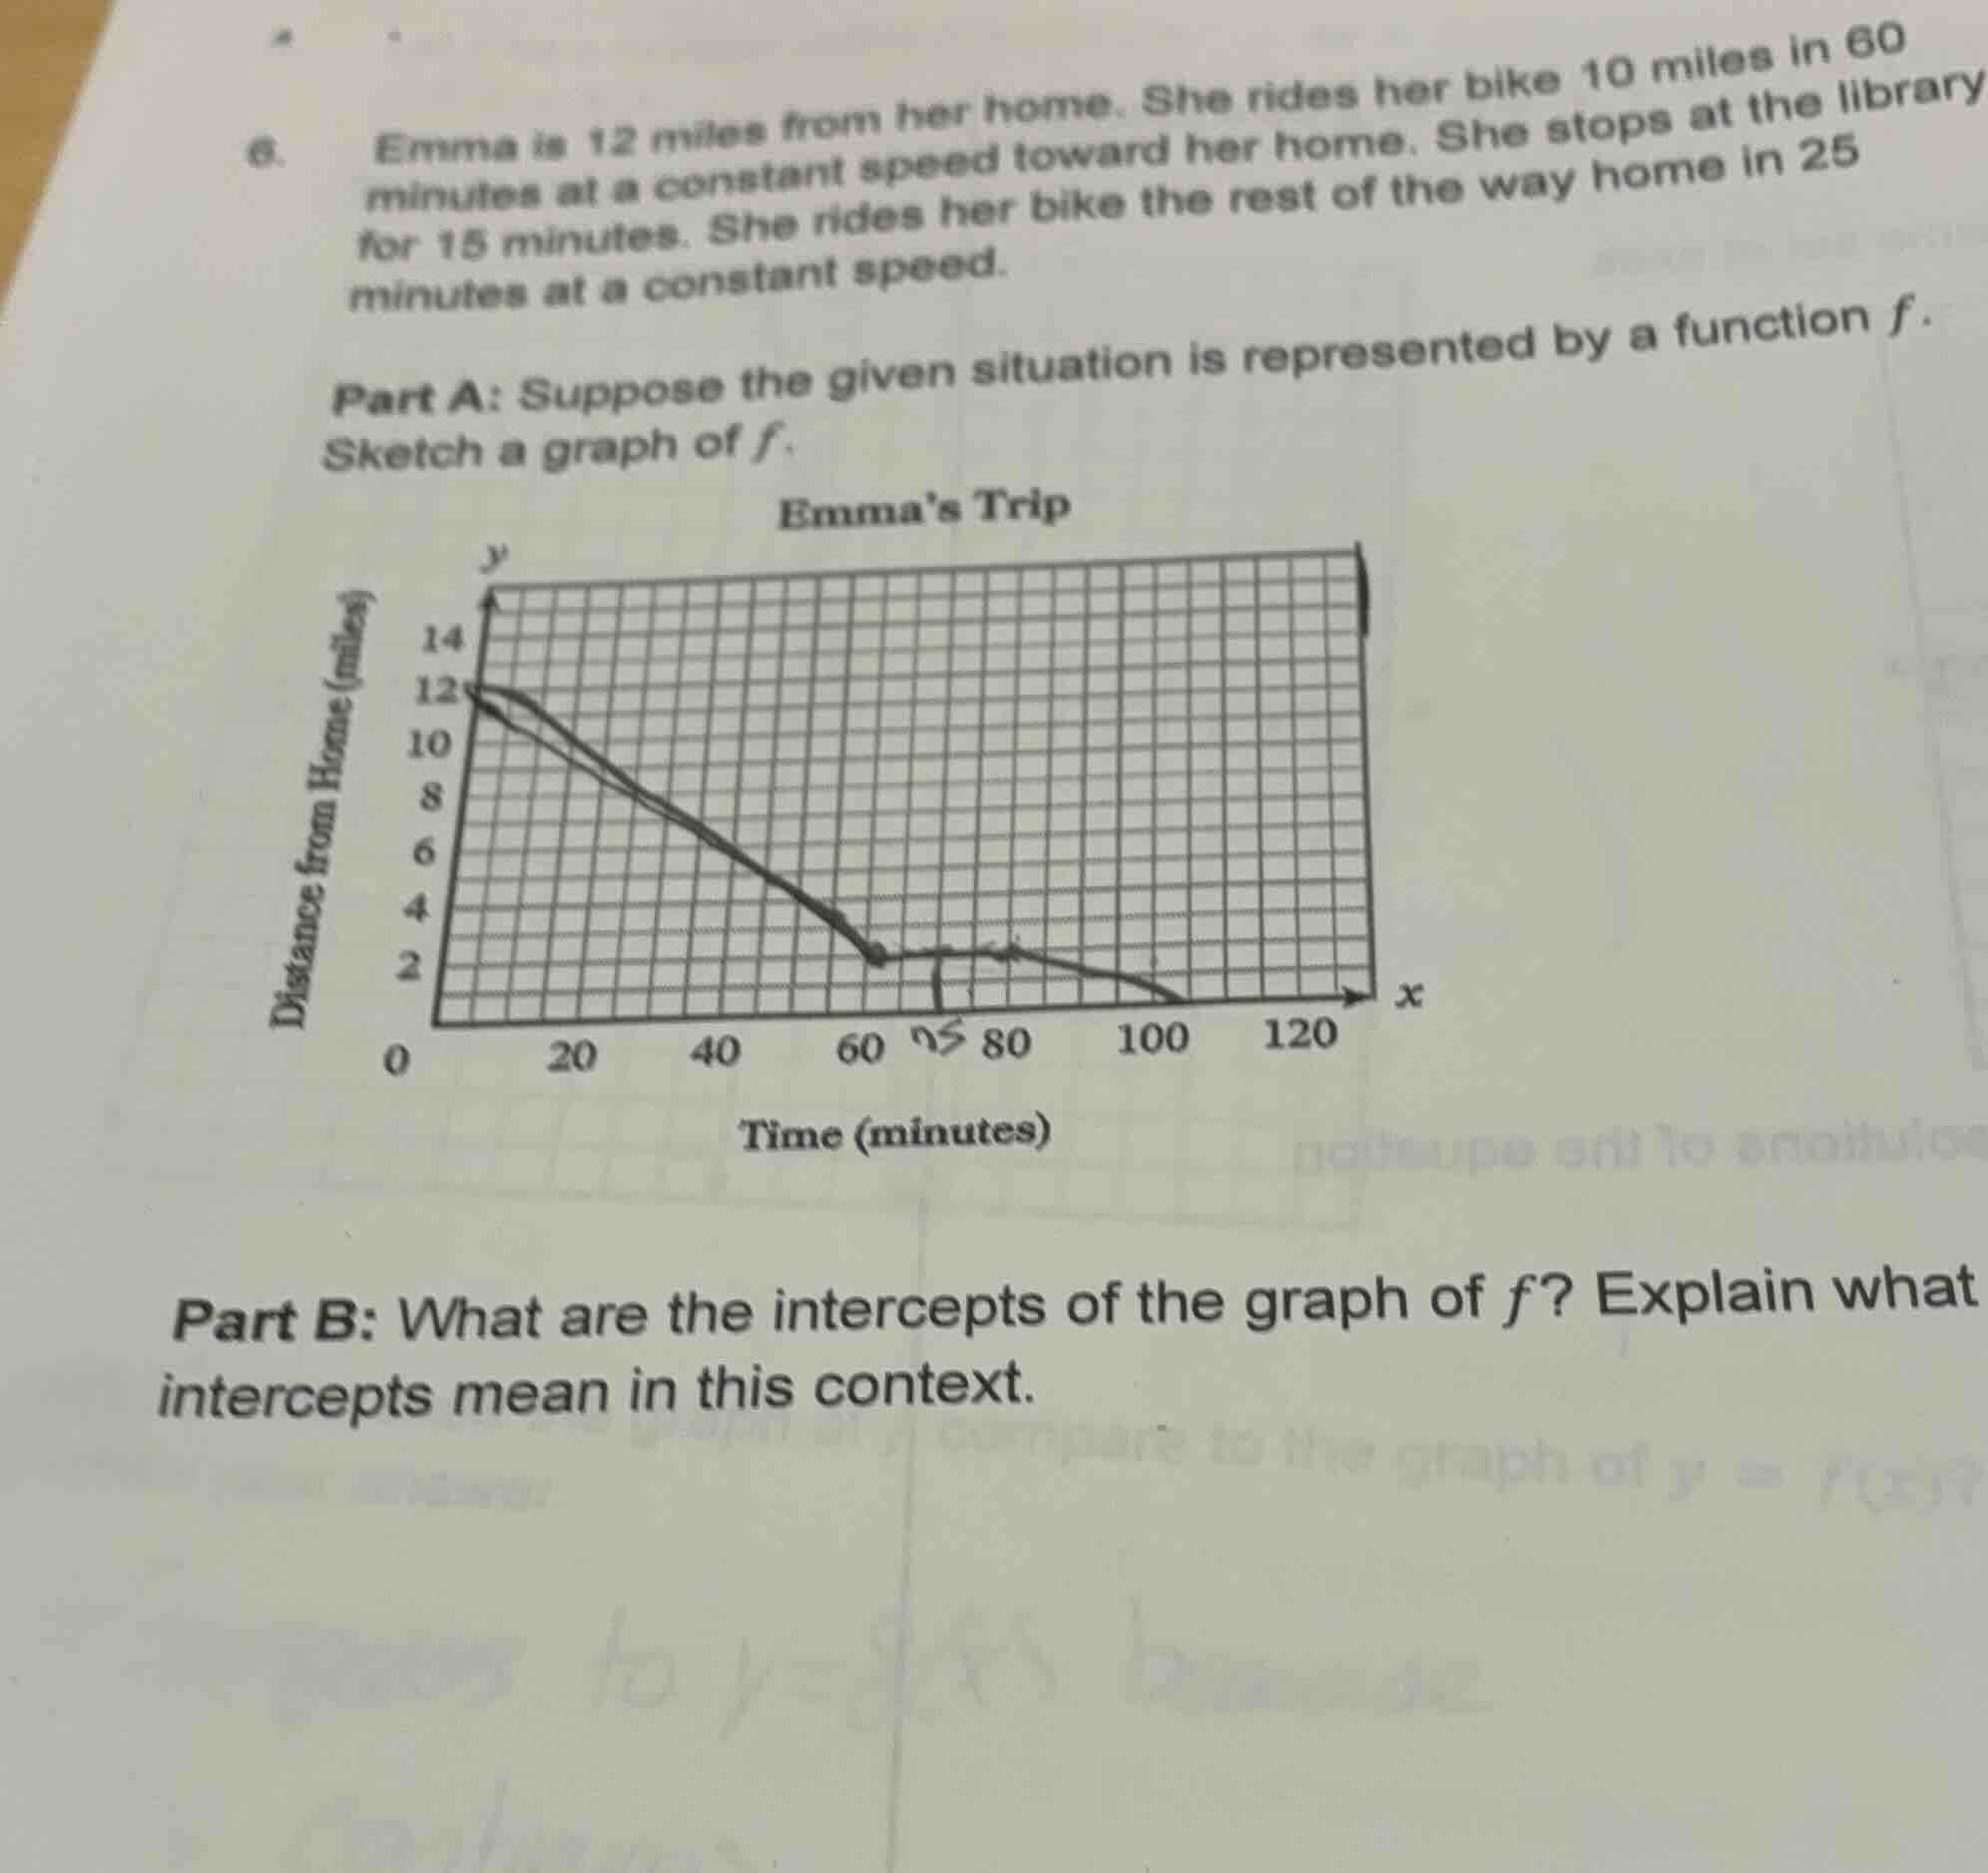
- emma is 12 miles from her home. she rides her bike 10 miles in 60 minutes at a constant speed toward her home. she stops at the library for 15 minutes. she rides her bike the rest of the way home in 25 minutes at a constant speed. part a: suppose the given situation is represented by a function f. sketch a graph of f. chart: emmas trip, x-axis time (minutes), y-axis distance from home (miles) part b: what are the intercepts of the graph of f? explain what intercepts mean in this context.
Response
Part A:
Step 1: Identify Key Points
- At \( x = 0 \) (time = 0 minutes), Emma is 12 miles from home, so the point is \( (0, 12) \).
- She rides 10 miles in 60 minutes. The speed here is \( \frac{10}{60}=\frac{1}{6} \) miles per minute. After 60 minutes, the distance from home is \( 12 - 10 = 2 \) miles. So the point is \( (60, 2) \).
- She stops at the library for 15 minutes, so from \( x = 60 \) to \( x = 60 + 15 = 75 \) minutes, the distance remains 2 miles. So the points are \( (60, 2) \) to \( (75, 2) \).
- Then she rides the remaining 2 miles in 25 minutes. The speed here is \( \frac{2}{25} \) miles per minute. After \( 75 + 25 = 100 \) minutes, she reaches home (distance = 0). So the point is \( (100, 0) \).
Step 2: Sketch the Graph
- Plot the points \( (0, 12) \), \( (60, 2) \), \( (75, 2) \), and \( (100, 0) \).
- Draw a line from \( (0, 12) \) to \( (60, 2) \) (representing the first ride).
- Draw a horizontal line from \( (60, 2) \) to \( (75, 2) \) (representing the stop at the library).
- Draw a line from \( (75, 2) \) to \( (100, 0) \) (representing the final ride home).
Part B:
Brief Explanations
- y - intercept: The y - intercept occurs where \( x = 0 \). From the graph, when \( x = 0 \), \( y = 12 \). In context, this means that at time \( t = 0 \) minutes (the start of Emma's trip), she is 12 miles away from her home.
- x - intercept: The x - intercept occurs where \( y = 0 \). From the graph, when \( y = 0 \), \( x = 100 \). In context, this means that after 100 minutes, Emma has reached her home (the distance from her home is 0 miles).

Snap & solve any problem in the app
Get step-by-step solutions on Sovi AI
Photo-based solutions with guided steps
Explore more problems and detailed explanations
(Part A Sketch Description):
- The graph starts at (0, 12), has a line decreasing to (60, 2), a horizontal line to (75, 2), and then a line decreasing to (100, 0).