QUESTION IMAGE
Question
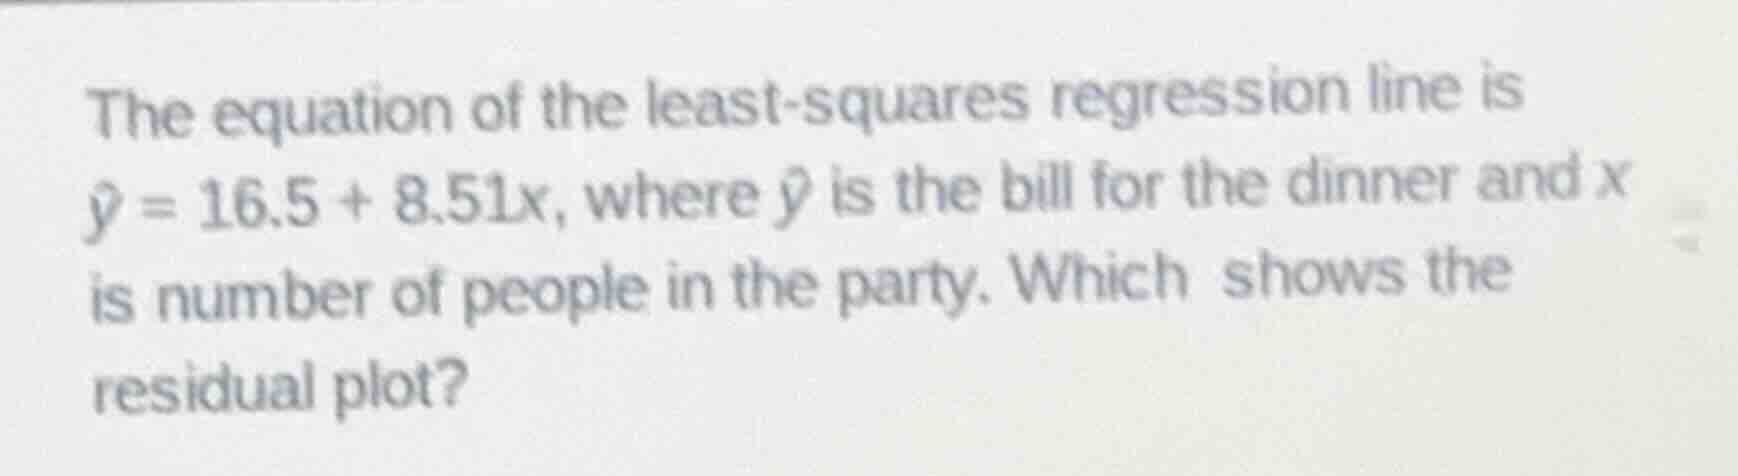
the equation of the least-squares regression line is \\(\hat{y} = 16.5 + 8.51x\\), where \\(\hat{y}\\) is the bill for the dinner and \\(x\\) is number of people in the party. which shows the residual plot?
To determine the residual plot for the least - squares regression line \(\hat{y}=16.5 + 8.51x\), we first need to recall what a residual is. The residual \(e\) is calculated as the actual value \(y\) minus the predicted value \(\hat{y}\), i.e., \(e=y - \hat{y}\).
Step 1: Understand the properties of a good residual plot
For a linear regression model (like the least - squares regression line we have here), a residual plot that is a good fit (indicating that the linear model is appropriate) should have the following characteristics:
- The residuals should be randomly scattered around the horizontal line \(y = 0\) (the line representing zero residual). There should be no obvious pattern (such as a curve, a increasing or decreasing trend) in the residual plot. If there is a pattern, it means that the linear model may not be the best fit for the data.
- The spread of the residuals (the vertical distance from the points to the \(y = 0\) line) should be relatively constant as \(x\) (the number of people in the party, in our case) changes. This is called homoscedasticity. If the spread of the residuals increases or decreases as \(x\) changes, it is a sign of heteroscedasticity, and the linear model may not be appropriate.
Since we don't have the actual data points (the values of \(x\), \(y\)) to calculate the residuals directly, we rely on the properties of the residual plot for a linear regression model:
- A residual plot for a linear regression model with the equation \(\hat{y}=16.5 + 8.51x\) should show residuals (the difference between the actual dinner bill \(y\) and the predicted dinner bill \(\hat{y}\)) that are randomly distributed around the line \(y = 0\) (no pattern like a curve or a consistent upward/downward trend) and have a relatively constant spread as \(x\) (number of people) changes.
- If we had the data, we would calculate the residual for each data point \((x_i,y_i)\) as \(e_i=y_i-(16.5 + 8.51x_i)\) and then plot these \(e_i\) values against \(x_i\).
However, since the question is about identifying the residual plot (and we assume that we have a set of plots to choose from, even though they are not shown here), the correct residual plot will be the one where:
- The residuals are randomly scattered around \(y = 0\).
- There is no pattern (such as a curved or linear trend) in the residuals with respect to the independent variable \(x\) (number of people).
- The spread of the residuals is relatively constant across different values of \(x\).
Since we don't have the actual plots, but based on the theory of residual plots for linear regression:
The residual plot that is appropriate for the linear regression model \(\hat{y}=16.5 + 8.51x\) will have residuals that are randomly dispersed around \(y = 0\) with no obvious pattern (no trend, no curve) and a relatively constant spread as \(x\) changes.
If we assume that we have a set of options (A, B, C, D etc.), the correct option will be the one that satisfies the above - mentioned properties of a residual plot for a linear regression model.
(Note: Since the actual plots are not provided, we can only give the general criteria for identifying the correct residual plot. If the plots were provided, we would check each plot against these criteria to find the correct one.)

Snap & solve any problem in the app
Get step-by-step solutions on Sovi AI
Photo-based solutions with guided steps
Explore more problems and detailed explanations
To determine the residual plot for the least - squares regression line \(\hat{y}=16.5 + 8.51x\), we first need to recall what a residual is. The residual \(e\) is calculated as the actual value \(y\) minus the predicted value \(\hat{y}\), i.e., \(e=y - \hat{y}\).
Step 1: Understand the properties of a good residual plot
For a linear regression model (like the least - squares regression line we have here), a residual plot that is a good fit (indicating that the linear model is appropriate) should have the following characteristics:
- The residuals should be randomly scattered around the horizontal line \(y = 0\) (the line representing zero residual). There should be no obvious pattern (such as a curve, a increasing or decreasing trend) in the residual plot. If there is a pattern, it means that the linear model may not be the best fit for the data.
- The spread of the residuals (the vertical distance from the points to the \(y = 0\) line) should be relatively constant as \(x\) (the number of people in the party, in our case) changes. This is called homoscedasticity. If the spread of the residuals increases or decreases as \(x\) changes, it is a sign of heteroscedasticity, and the linear model may not be appropriate.
Since we don't have the actual data points (the values of \(x\), \(y\)) to calculate the residuals directly, we rely on the properties of the residual plot for a linear regression model:
- A residual plot for a linear regression model with the equation \(\hat{y}=16.5 + 8.51x\) should show residuals (the difference between the actual dinner bill \(y\) and the predicted dinner bill \(\hat{y}\)) that are randomly distributed around the line \(y = 0\) (no pattern like a curve or a consistent upward/downward trend) and have a relatively constant spread as \(x\) (number of people) changes.
- If we had the data, we would calculate the residual for each data point \((x_i,y_i)\) as \(e_i=y_i-(16.5 + 8.51x_i)\) and then plot these \(e_i\) values against \(x_i\).
However, since the question is about identifying the residual plot (and we assume that we have a set of plots to choose from, even though they are not shown here), the correct residual plot will be the one where:
- The residuals are randomly scattered around \(y = 0\).
- There is no pattern (such as a curved or linear trend) in the residuals with respect to the independent variable \(x\) (number of people).
- The spread of the residuals is relatively constant across different values of \(x\).
Since we don't have the actual plots, but based on the theory of residual plots for linear regression:
The residual plot that is appropriate for the linear regression model \(\hat{y}=16.5 + 8.51x\) will have residuals that are randomly dispersed around \(y = 0\) with no obvious pattern (no trend, no curve) and a relatively constant spread as \(x\) changes.
If we assume that we have a set of options (A, B, C, D etc.), the correct option will be the one that satisfies the above - mentioned properties of a residual plot for a linear regression model.
(Note: Since the actual plots are not provided, we can only give the general criteria for identifying the correct residual plot. If the plots were provided, we would check each plot against these criteria to find the correct one.)