QUESTION IMAGE
Question
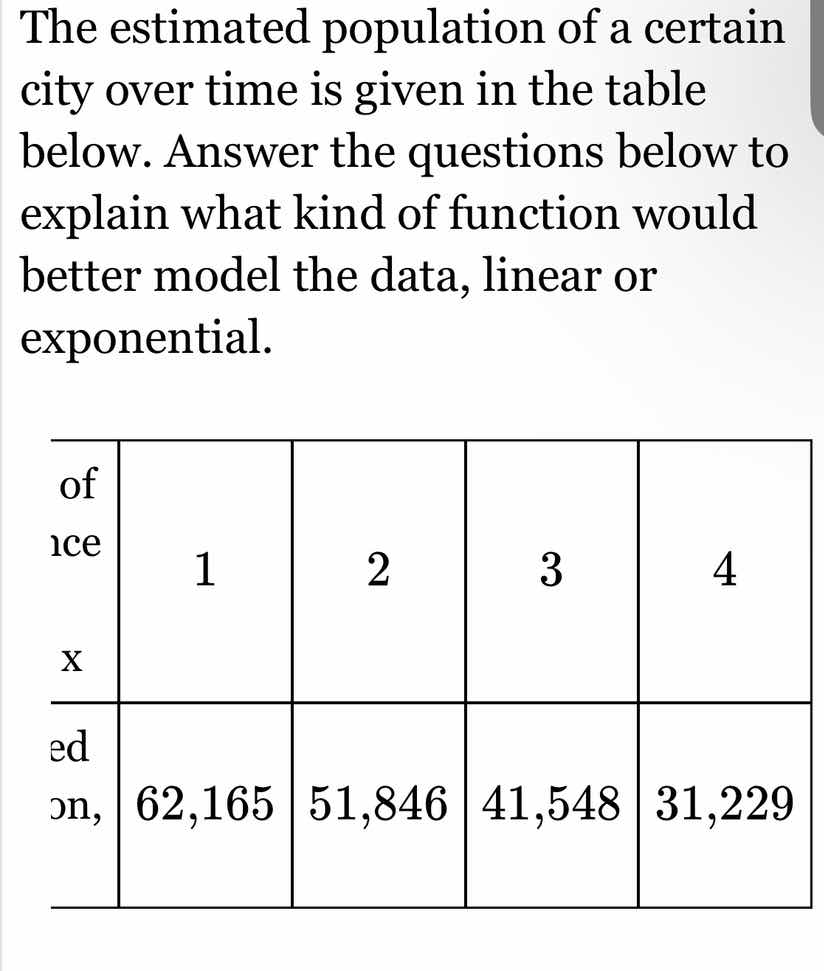
the estimated population of a certain city over time is given in the table below. answer the questions below to explain what kind of function would better model the data, linear or exponential.
(the table has columns with x values 1, 2, 3, 4 and corresponding population values 62,165; 51,846; 41,548; 31,229)
Step1: Calculate differences (linear check)
Find the differences between consecutive \( y \)-values:
\( 51846 - 62165 = -10319 \)
\( 41548 - 51846 = -10298 \)
\( 31229 - 41548 = -10319 \)
Step2: Calculate ratios (exponential check)
Find the ratios of consecutive \( y \)-values:
\( \frac{51846}{62165} \approx 0.834 \)
\( \frac{41548}{51846} \approx 0.801 \)
\( \frac{31229}{41548} \approx 0.752 \)
Wait, actually, the differences are relatively close (around -10300), while ratios vary more. Wait, no—wait, the first difference: -10319, second: -10298, third: -10319. These are almost constant (difference between differences: \( -10298 - (-10319) = 21 \), \( -10319 - (-10298) = -21 \)), so the first differences are nearly constant. Wait, but let's recheck:
Wait, \( 62165 - 51846 = 10319 \) (decrease), \( 51846 - 41548 = 10298 \) (decrease), \( 41548 - 31229 = 10319 \) (decrease). So the decreases (differences) are approximately constant (10319, 10298, 10319—very close). For exponential, the ratio should be constant, but here ratios are ~0.834, 0.801, 0.752—more variation. Wait, maybe I miscalculated ratios. Wait, \( 51846 / 62165 \approx 0.834 \), \( 41548 / 51846 \approx 0.801 \), \( 31229 / 41548 \approx 0.752 \). But the differences: -10319, -10298, -10319. These are almost the same (difference between -10319 and -10298 is 21, which is small compared to the values). So the first differences are nearly constant, indicating a linear model (since linear functions have constant first differences, exponential have constant ratios). Wait, but wait—maybe the table is x=1,2,3,4 (time) and y=population. Wait, the population is decreasing, and the differences between consecutive years are almost constant. So linear model is better because the first differences (changes in population) are approximately constant, while ratios (growth/decay factor) are not constant.

Snap & solve any problem in the app
Get step-by-step solutions on Sovi AI
Photo-based solutions with guided steps
Explore more problems and detailed explanations
Linear function (because the first differences between consecutive population values are approximately constant, indicating a linear relationship, while the ratios are not constant, ruling out exponential).