QUESTION IMAGE
Question
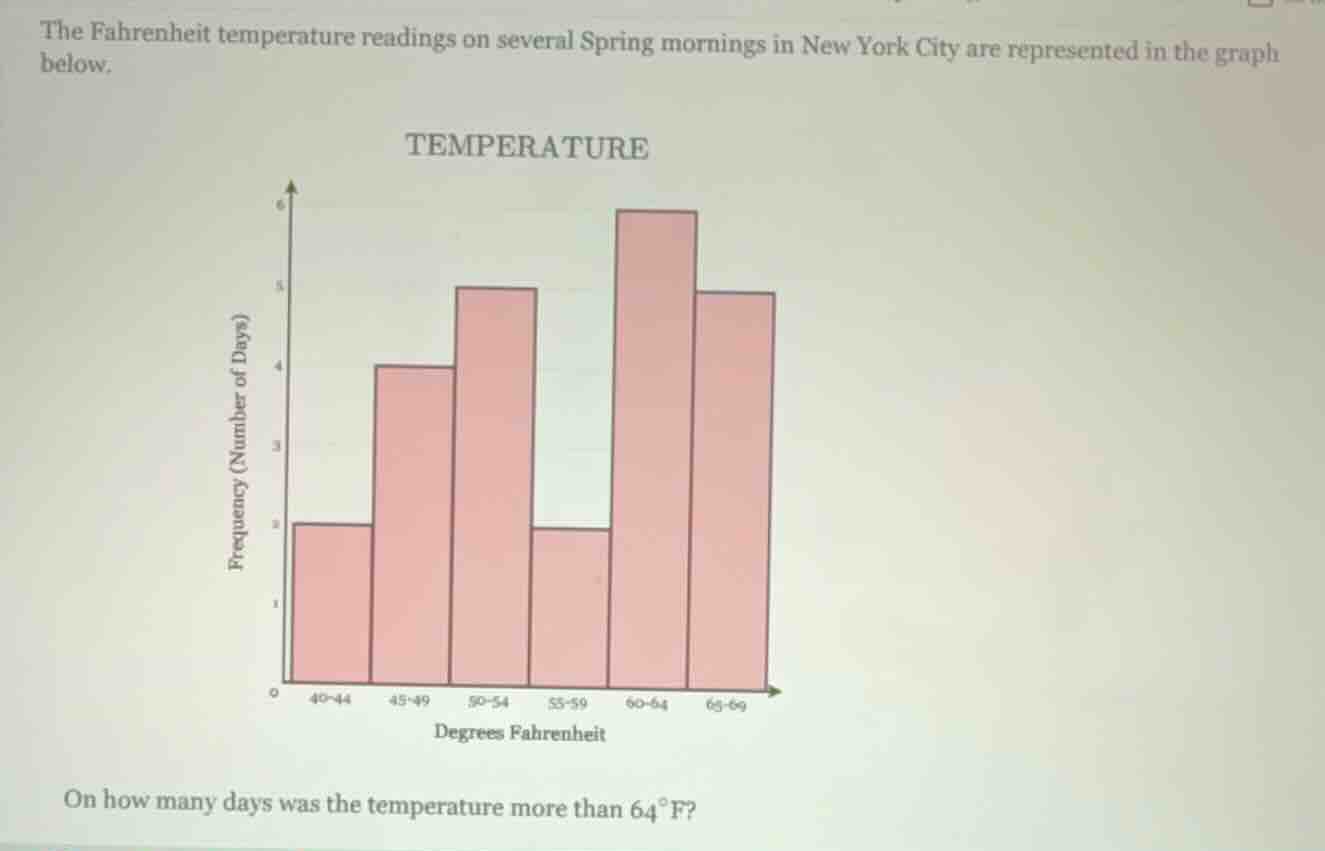
the fahrenheit temperature readings on several spring mornings in new york city are represented in the graph below.
temperature
bar graph with x - axis labeled degrees fahrenheit (ranges: 40 - 44, 45 - 49, 50 - 54, 55 - 59, 60 - 64, 65 - 69) and y - axis labeled frequency (number of days) (0 - 6). bars: 40 - 44: height 2; 45 - 49: height 4; 50 - 54: height 5; 55 - 59: height 2; 60 - 64: height 6; 65 - 69: height 5
on how many days was the temperature more than 64°f?
Step1: Identify the relevant interval
The temperature more than \(64^\circ\text{F}\) corresponds to the interval \(65 - 69\) (since the intervals are \(40 - 44\), \(45 - 49\), \(50 - 54\), \(55 - 59\), \(60 - 64\), \(65 - 69\)).
Step2: Find the frequency for the interval
From the bar graph, the frequency (number of days) for the interval \(65 - 69\) is \(5\).

Snap & solve any problem in the app
Get step-by-step solutions on Sovi AI
Photo-based solutions with guided steps
Explore more problems and detailed explanations
\(5\)