QUESTION IMAGE
Question
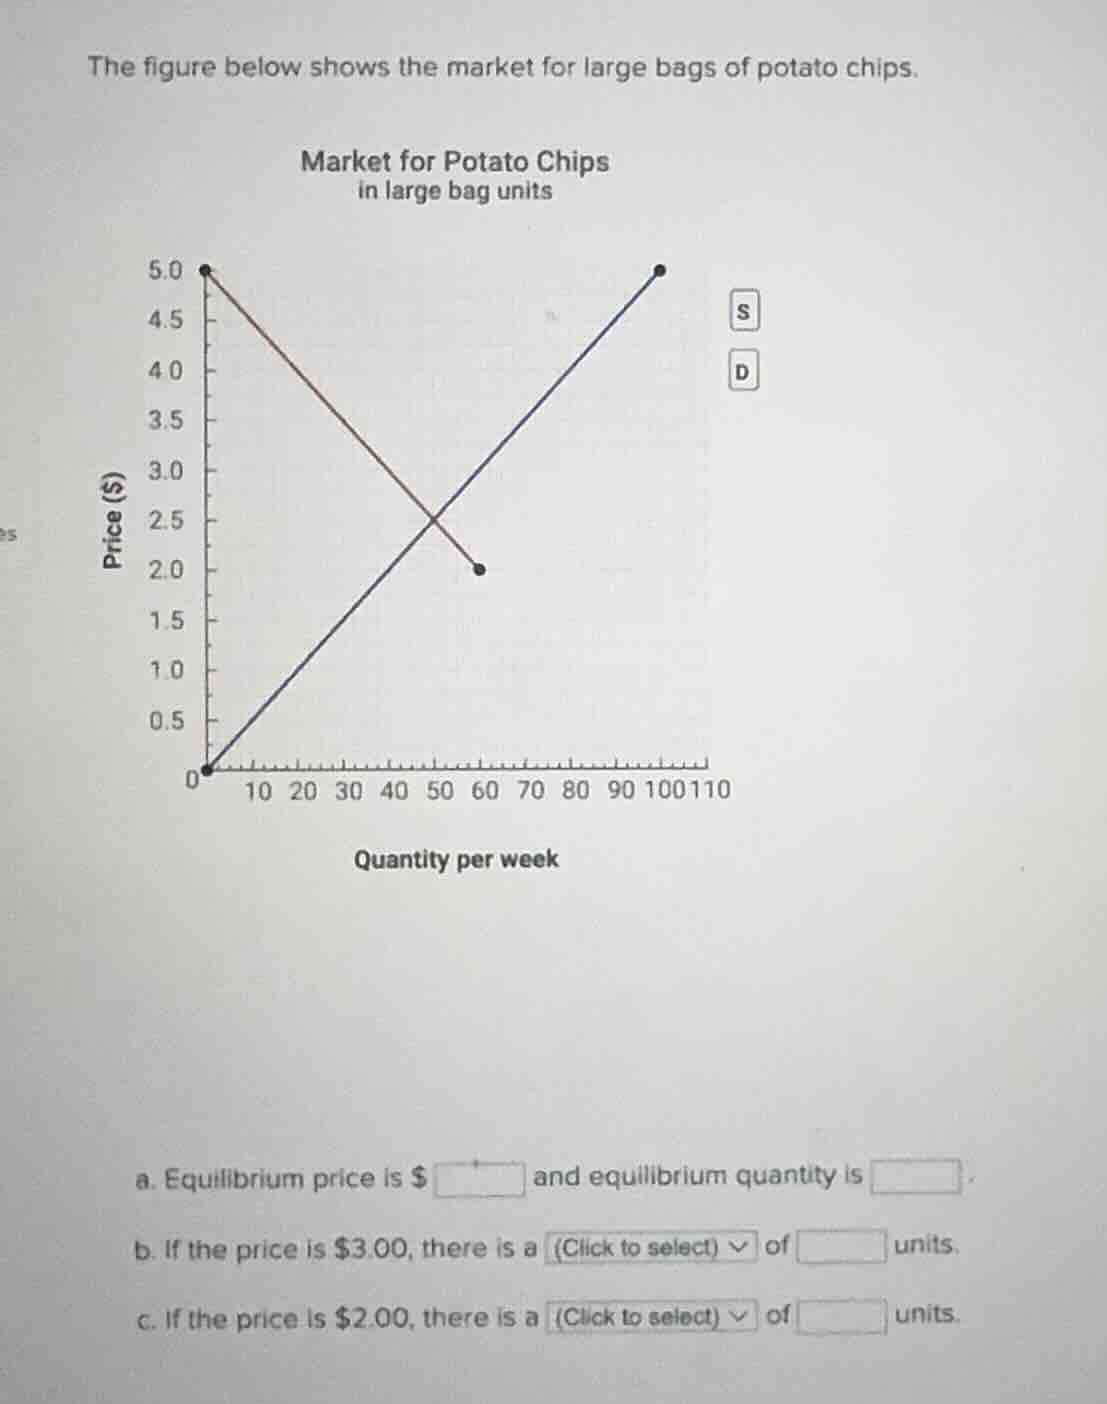
the figure below shows the market for large bags of potato chips.
market for potato chips
in large bag units
a. equilibrium price is $ \square $ and equilibrium quantity is $ \square $
b. if the price is $3.00, there is a (click to select) $\boldsymbol{\vee}$ of $\square$ units.
c. if the price is $2.00, there is a (click to select) $\boldsymbol{\vee}$ of $\square$ units.
Step1: Find equilibrium (intersection)
Equilibrium is where supply (S) and demand (D) curves cross. From the graph, this occurs at price $\$2.50$ and quantity 50 units.
Step2: Analyze price = $\$3.00$
At $\$3.00$, find quantity supplied ($Q_s$) and demanded ($Q_d$):
- $Q_s$ (from supply curve): 80 units
- $Q_d$ (from demand curve): 30 units
Surplus = $Q_s - Q_d = 80 - 30 = 50$ units
Step3: Analyze price = $\$2.00$
At $\$2.00$, find quantity supplied ($Q_s$) and demanded ($Q_d$):
- $Q_s$ (from supply curve): 40 units
- $Q_d$ (from demand curve): 60 units
Shortage = $Q_d - Q_s = 60 - 40 = 20$ units

Snap & solve any problem in the app
Get step-by-step solutions on Sovi AI
Photo-based solutions with guided steps
Explore more problems and detailed explanations
a. Equilibrium price is $\$2.50$ and equilibrium quantity is 50 units
b. If the price is $\$3.00$, there is a surplus of 50 units
c. If the price is $\$2.00$, there is a shortage of 20 units