QUESTION IMAGE
Question
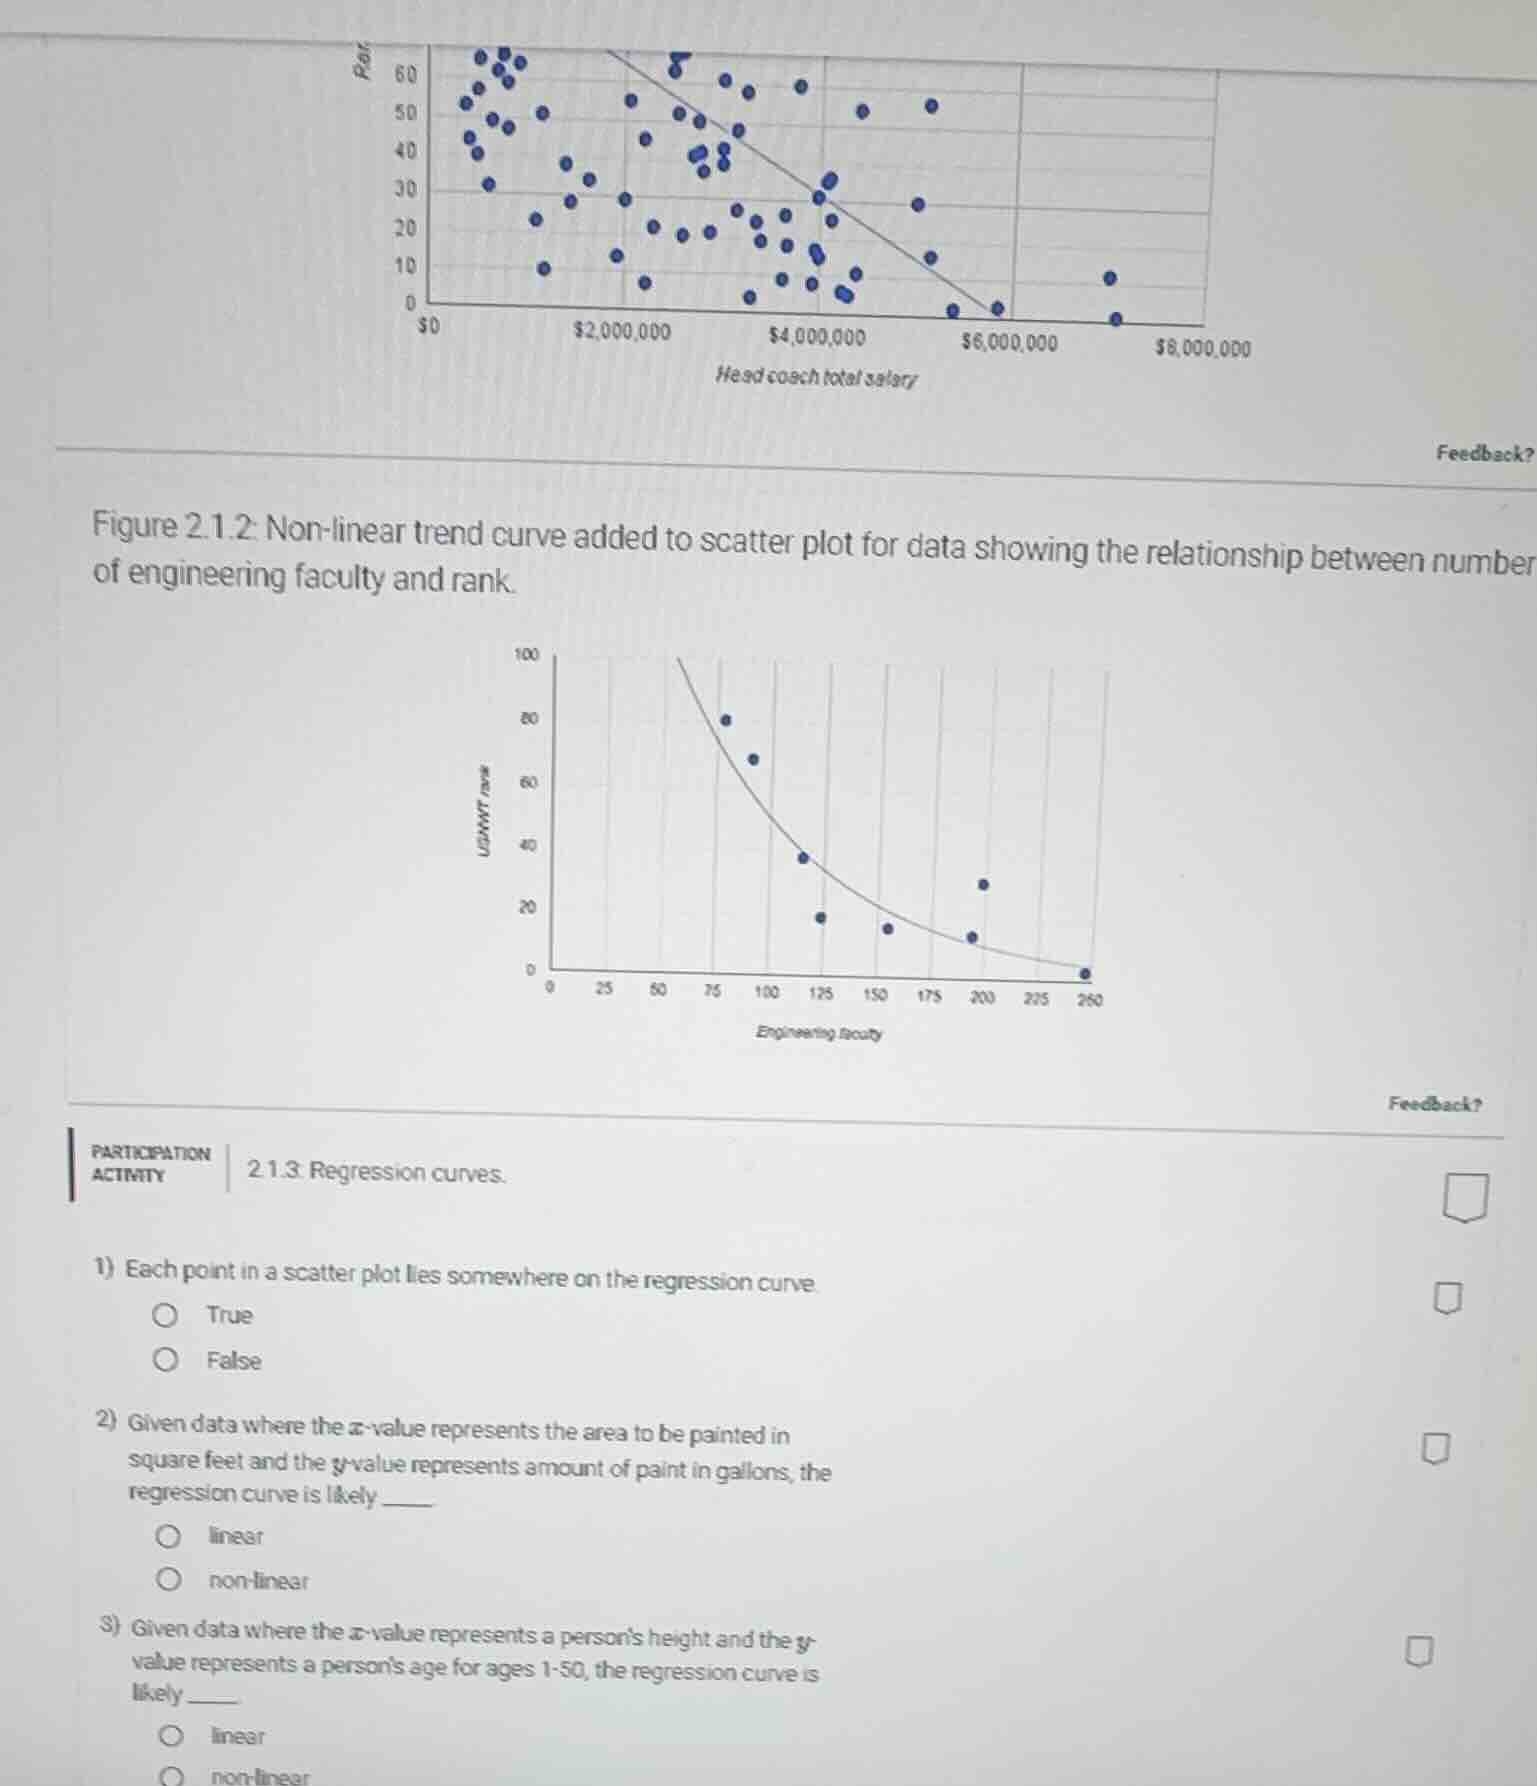
figure 2.1.2: non - linear trend curve added to scatter plot for data showing the relationship between number of engineering faculty and rank.
participation activity
2.1.3: regression curves.
- each point in a scatter plot lies somewhere on the regression curve.
true
false
- given data where the x - value represents the area to be painted in square feet and the y - value represents amount of paint in gallons, the regression curve is likely _____
linear
non - linear
- given data where the x - value represents a persons height and the y - value represents a persons age for ages 1 - 50, the regression curve is likely _____
linear
non - linear
Brief Explanations
- A regression curve is a line/curve that models the general trend of scatter plot points; most points do not lie directly on it, they only follow its trend.
- The amount of paint needed increases proportionally with the area to be painted, which is a direct linear relationship.
- A person's height increases rapidly in early ages, then stops growing after adolescence, creating a non-linear (plateauing) relationship with age 1-50.

Snap & solve any problem in the app
Get step-by-step solutions on Sovi AI
Photo-based solutions with guided steps
Explore more problems and detailed explanations
- False
- linear
- non-linear