QUESTION IMAGE
Question
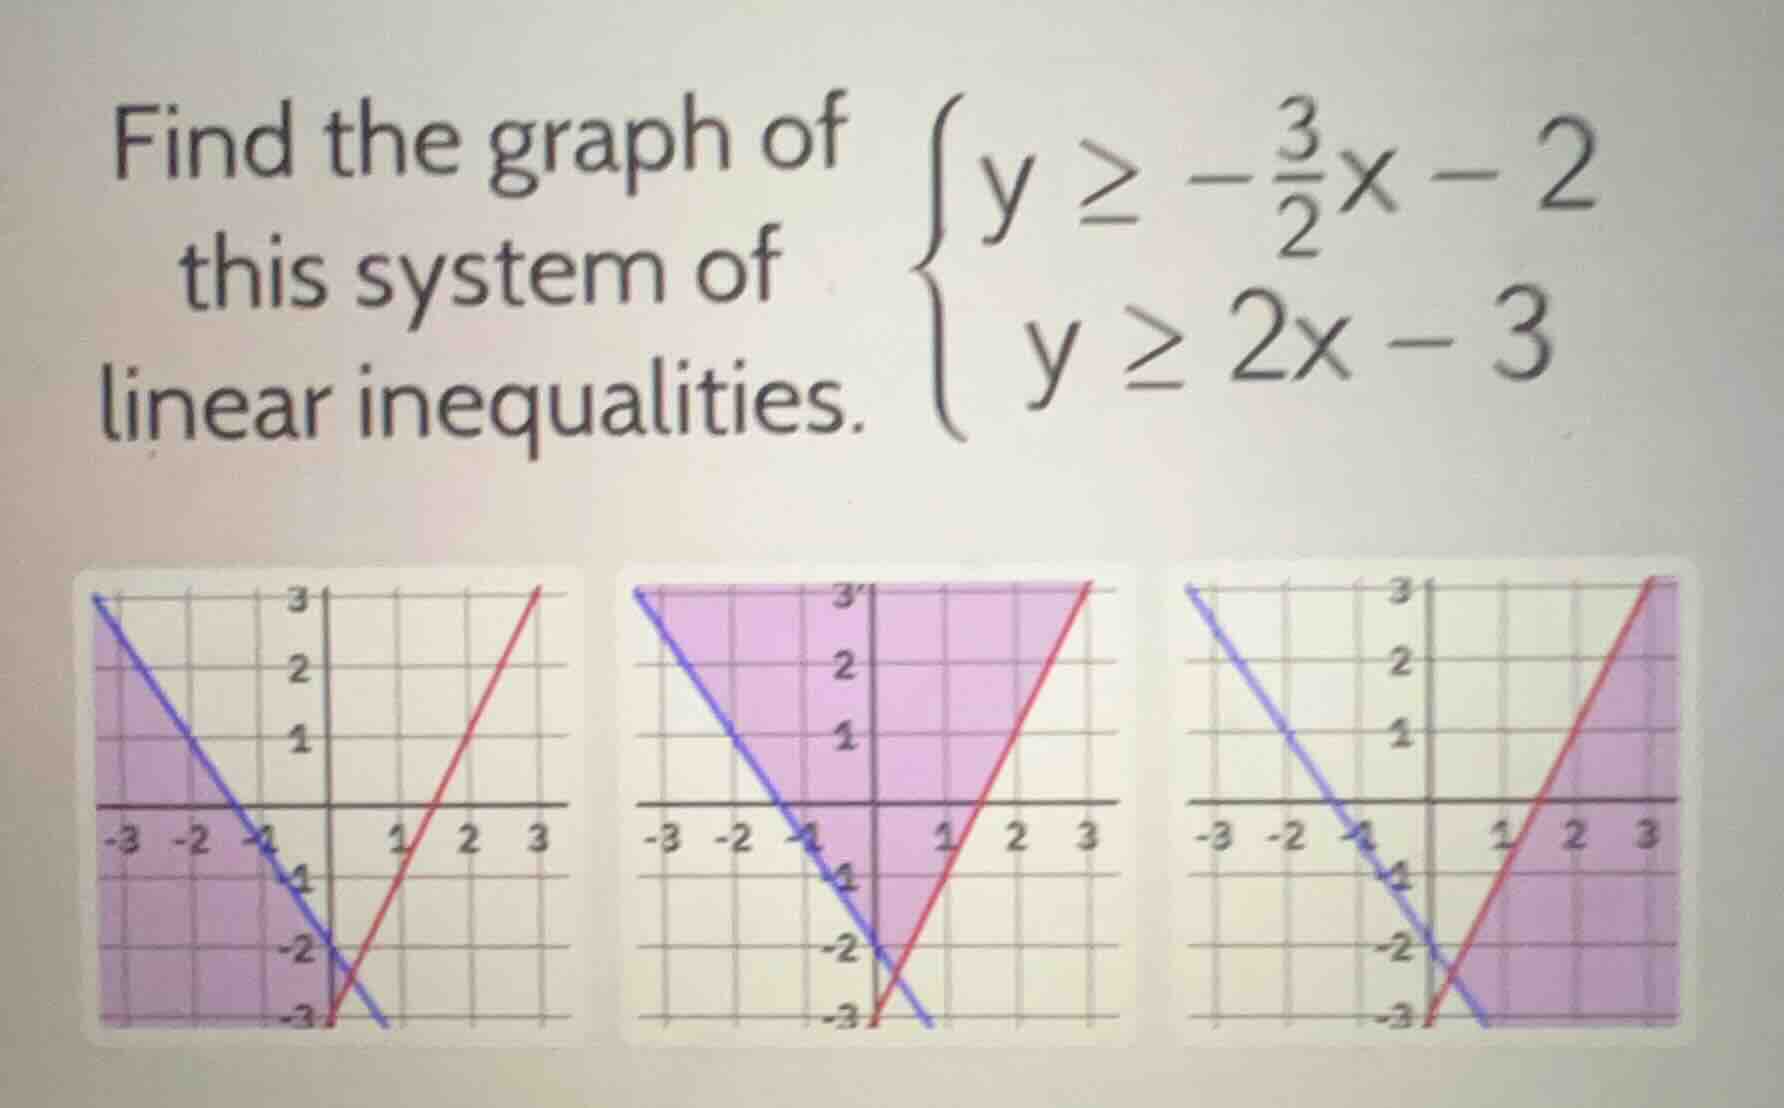
find the graph of this system of linear inequalities. \\(\
\\)
Step1: Analyze the first inequality \( y \geq -\frac{3}{2}x - 2 \)
The line \( y = -\frac{3}{2}x - 2 \) has a slope of \( -\frac{3}{2} \) and a y - intercept of \( - 2 \). Since the inequality is \( y\geq-\frac{3}{2}x - 2 \), we draw a solid line (because the inequality is non - strict) and shade the region above the line. We can test a point, for example, the origin \((0,0)\). Substitute \( x = 0,y = 0 \) into the inequality: \( 0\geq-\frac{3}{2}(0)-2= - 2 \), which is true. So the region including the origin and above the line \( y = -\frac{3}{2}x - 2 \) is part of the solution for this inequality.
Step2: Analyze the second inequality \( y\geq2x - 3 \)
The line \( y = 2x - 3 \) has a slope of \( 2 \) and a y - intercept of \( - 3 \). Since the inequality is \( y\geq2x - 3 \), we draw a solid line (because the inequality is non - strict) and shade the region above the line. Test the origin \((0,0)\): \( 0\geq2(0)-3=-3 \), which is true. So the region including the origin and above the line \( y = 2x - 3 \) is part of the solution for this inequality.
Step3: Find the intersection of the two regions
The solution of the system of inequalities is the intersection of the regions defined by each individual inequality. We need to find the region that is above both lines \( y = -\frac{3}{2}x - 2 \) and \( y = 2x - 3 \).
Let's find the intersection point of the two lines \( y=-\frac{3}{2}x - 2 \) and \( y = 2x-3 \). Set \( -\frac{3}{2}x - 2=2x - 3 \).
Multiply through by 2 to get rid of the fraction: \( - 3x-4 = 4x-6 \).
Add \( 3x \) to both sides: \( - 4=7x - 6 \).
Add 6 to both sides: \( 2 = 7x \), so \( x=\frac{2}{7}\approx0.29 \).
Substitute \( x = \frac{2}{7} \) into \( y = 2x-3 \): \( y=2\times\frac{2}{7}-3=\frac{4}{7}-3=\frac{4 - 21}{7}=-\frac{17}{7}\approx - 2.43 \).
Now, let's analyze the three graphs:
- For the first graph: The shaded region is below one of the lines, so it's incorrect.
- For the second graph: The shaded region is above both lines \( y = -\frac{3}{2}x - 2 \) (the blue line) and \( y = 2x - 3 \) (the red line). We can see that the region includes the area that is above both lines.
- For the third graph: The shaded region is below one of the lines, so it's incorrect.

Snap & solve any problem in the app
Get step-by-step solutions on Sovi AI
Photo-based solutions with guided steps
Explore more problems and detailed explanations
The second graph (the one with the purple region above both the blue line \( y = -\frac{3}{2}x - 2 \) and the red line \( y = 2x - 3 \))