QUESTION IMAGE
Question
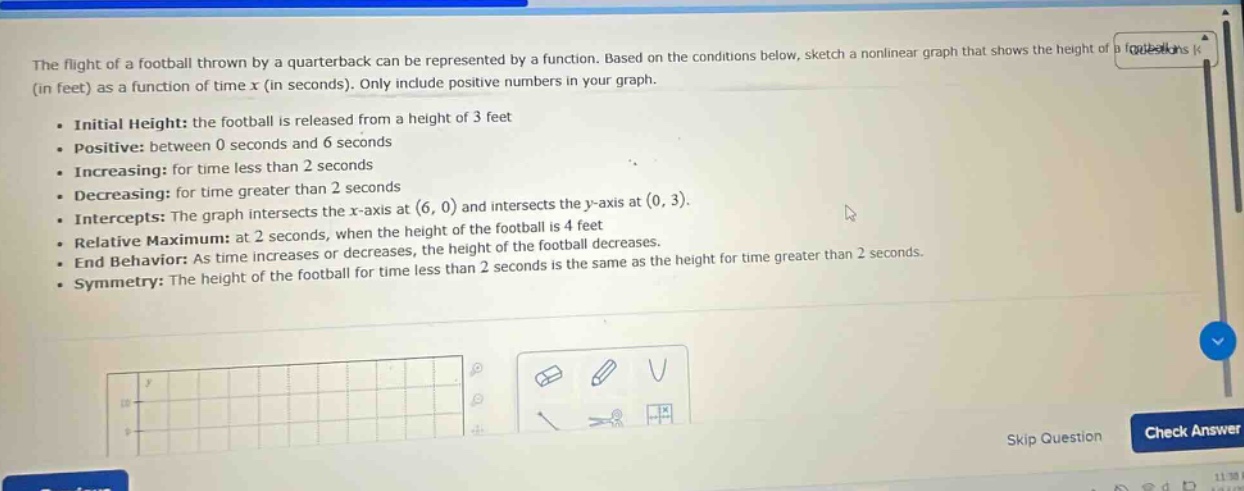
the flight of a football thrown by a quarterback can be represented by a function. based on the conditions below, sketch a nonlinear graph that shows the height of a football (in feet) as a function of time ( x ) (in seconds). only include positive numbers in your graph.
- initial height: the football is released from a height of 3 feet
- positive: between 0 seconds and 6 seconds
- increasing: for time less than 2 seconds
- decreasing: for time greater than 2 seconds
- intercepts: the graph intersects the ( x )-axis at ( (6, 0) ) and intersects the ( y )-axis at ( (0, 3) ).
- relative maximum: at 2 seconds, when the height of the football is 4 feet
- end behavior: as time increases or decreases, the height of the football decreases.
- symmetry: the height of the football for time less than 2 seconds is the same as the height for time greater than 2 seconds.
Step1: Identify Key Points
We have the following key points from the problem:
- The graph intersects the y - axis at \((0,3)\) and the x - axis at \((6,0)\).
- The relative maximum is at \((2,4)\).
- The function is increasing for \(x < 2\) and decreasing for \(x>2\). Also, the function is symmetric about \(x = 2\) (since the height for \(x < 2\) is the same as for \(x>2\)).
- The initial height (when \(x = 0\)) is 3 feet, and the ball hits the ground at \(x = 6\) seconds.
Step2: Plot the Intercepts
First, plot the y - intercept \((0,3)\) and the x - intercept \((6,0)\) on the coordinate plane.
Step3: Plot the Relative Maximum
Plot the point \((2,4)\) which is the relative maximum of the function.
Step4: Sketch the Increasing Part
Since the function is increasing for \(x<2\) and symmetric about \(x = 2\), we draw a curve from \((0,3)\) to \((2,4)\) that is increasing (the slope of the tangent to the curve is positive in this interval).
Step5: Sketch the Decreasing Part
Using the symmetry about \(x = 2\), the curve from \(x = 2\) to \(x=6\) should be a mirror image (with respect to the vertical line \(x = 2\)) of the curve from \(x = 0\) to \(x = 2\). So we draw a curve from \((2,4)\) to \((6,0)\) that is decreasing (the slope of the tangent to the curve is negative in this interval). Also, we ensure that as \(x\) moves away from 2 (in either direction), the height decreases, which is consistent with the end - behavior and the increasing/decreasing intervals.

Snap & solve any problem in the app
Get step-by-step solutions on Sovi AI
Photo-based solutions with guided steps
Explore more problems and detailed explanations
To sketch the graph:
- Plot the points \((0,3)\), \((2,4)\), and \((6,0)\).
- Draw a smooth curve from \((0,3)\) to \((2,4)\) (increasing for \(x < 2\)).
- Draw a smooth curve from \((2,4)\) to \((6,0)\) such that the curve is symmetric about the line \(x = 2\) (the part from \(x=0\) to \(x = 2\) and \(x = 2\) to \(x = 6\) are mirror images with respect to \(x = 2\)), and the curve is decreasing for \(x>2\). The graph should be a parabola - like curve (due to the symmetry and the increasing - then - decreasing nature) with vertex at \((2,4)\), passing through \((0,3)\) and \((6,0)\).