QUESTION IMAGE
Question
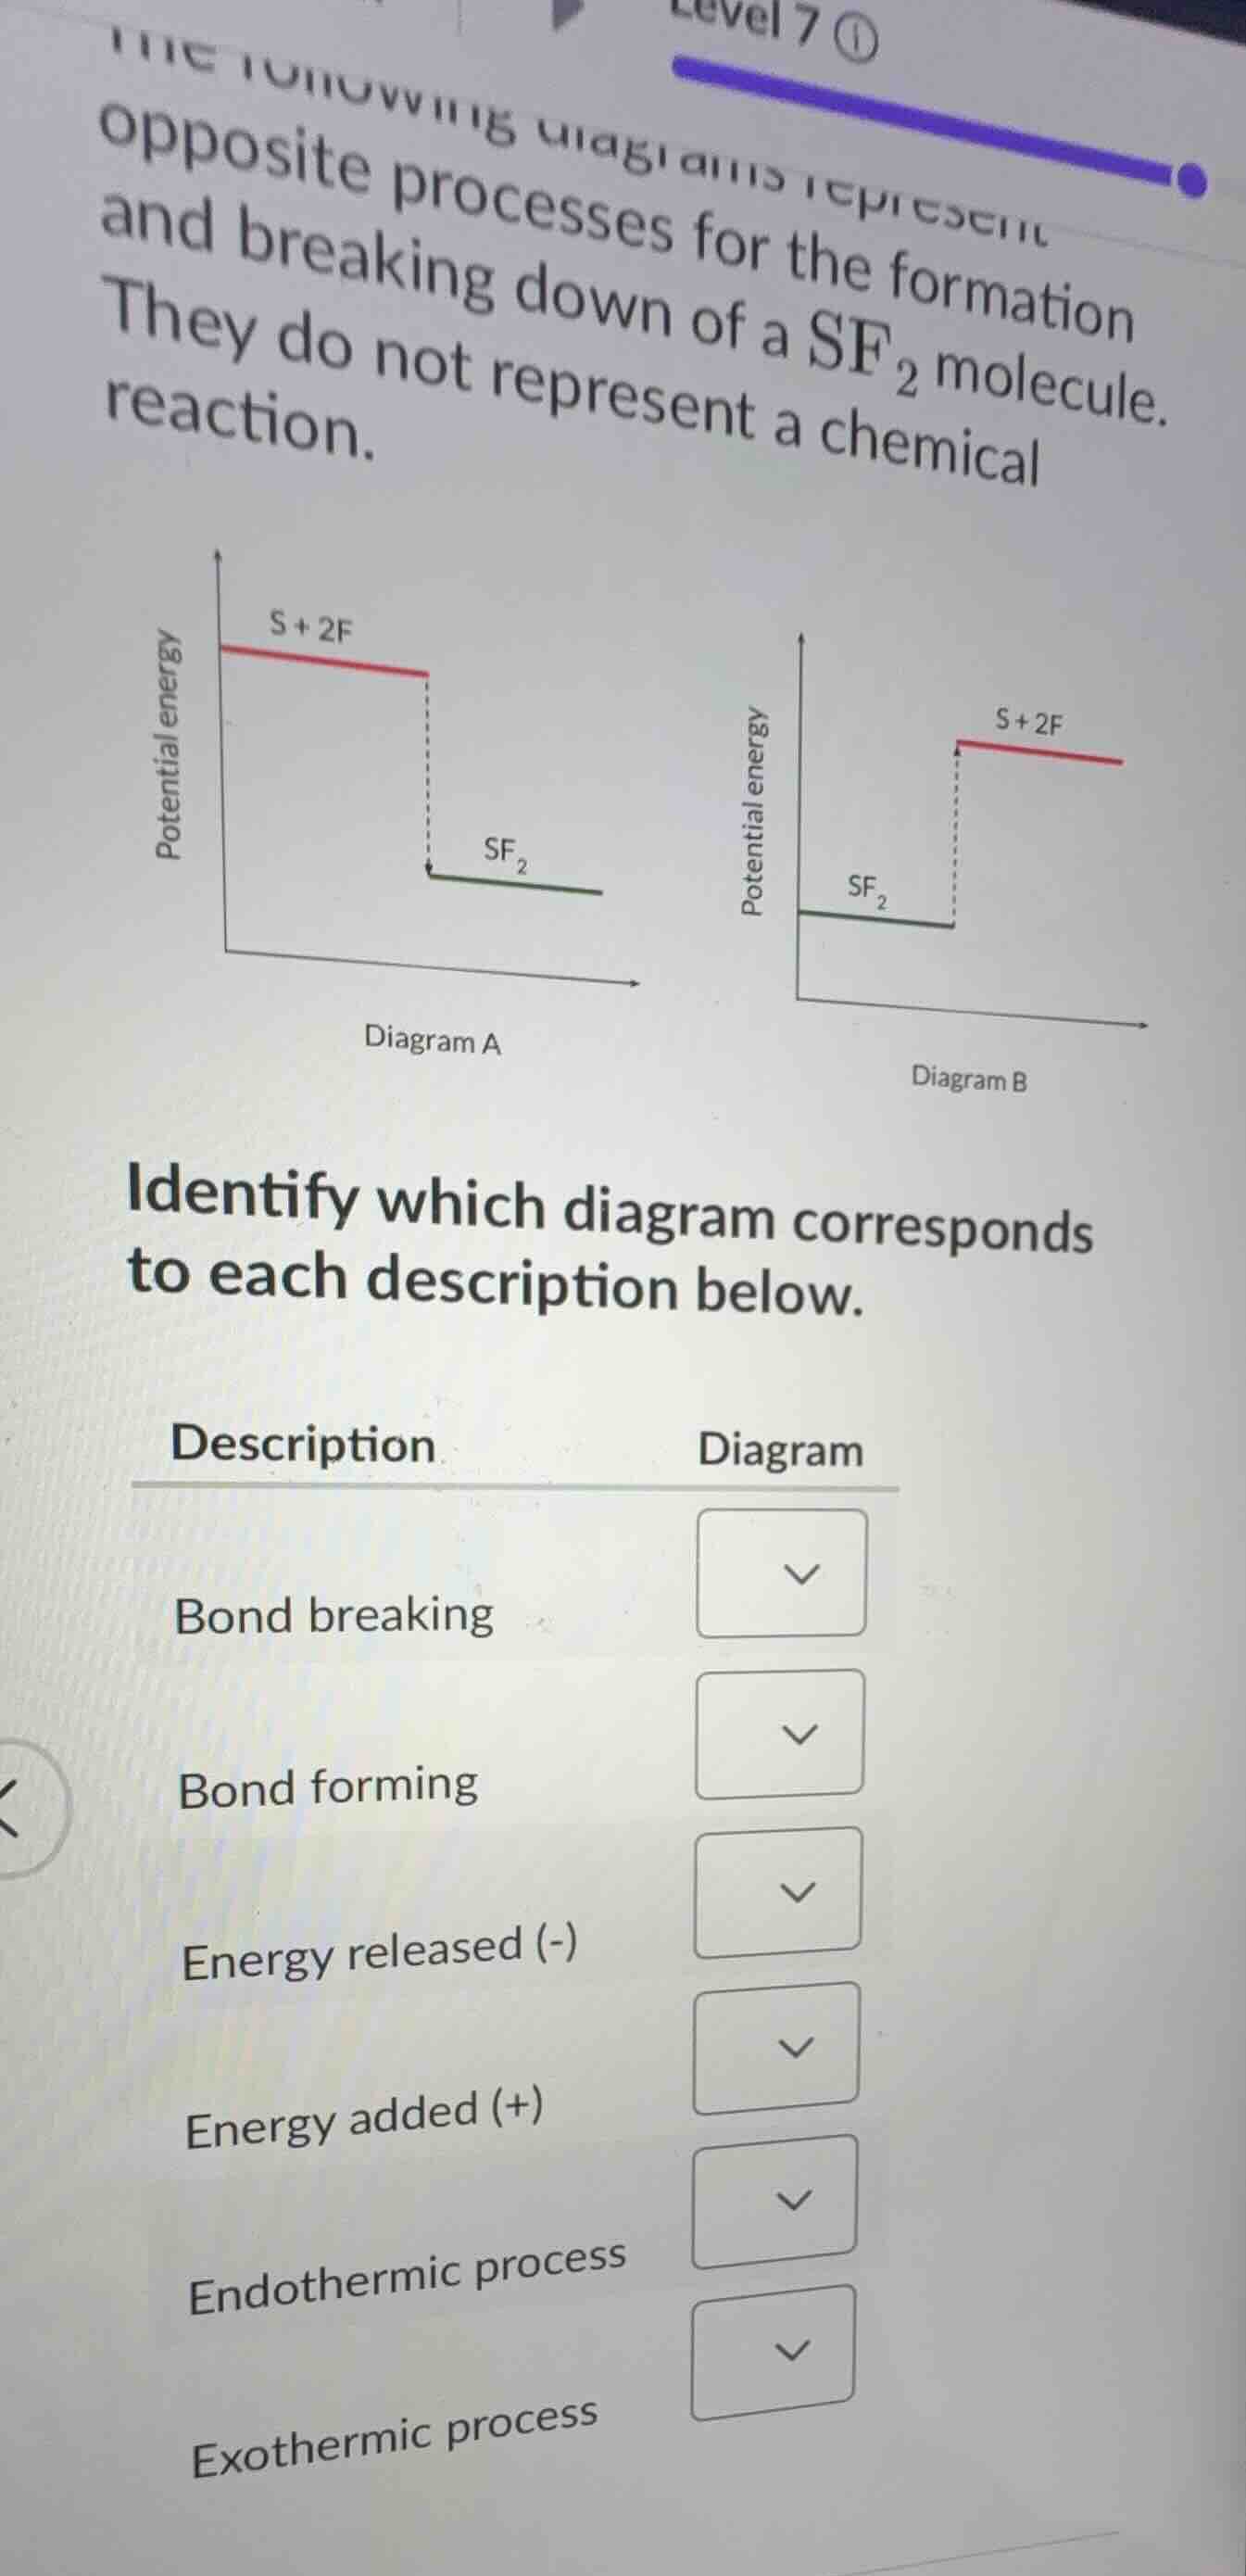
the following diagrams represent opposite processes for the formation and breaking down of a \\(\ce{sf_2}\\) molecule. they do not represent a chemical reaction.
identify which diagram corresponds to each description below.
| description | diagram |
|---|---|
| bond forming | \\(\boldsymbol{\downarrow}\\) |
| energy released (-) | \\(\boldsymbol{\downarrow}\\) |
| energy added (+) | \\(\boldsymbol{\downarrow}\\) |
| endothermic process | \\(\boldsymbol{\downarrow}\\) |
| exothermic process | \\(\boldsymbol{\downarrow}\\) |

Snap & solve any problem in the app
Get step-by-step solutions on Sovi AI
Photo-based solutions with guided steps
Explore more problems and detailed explanations
Bond breaking: Diagram B
Bond forming: Diagram A
Energy released (-): Diagram A
Energy added (+): Diagram B
Endothermic process: Diagram B
Exothermic process: Diagram A