QUESTION IMAGE
Question
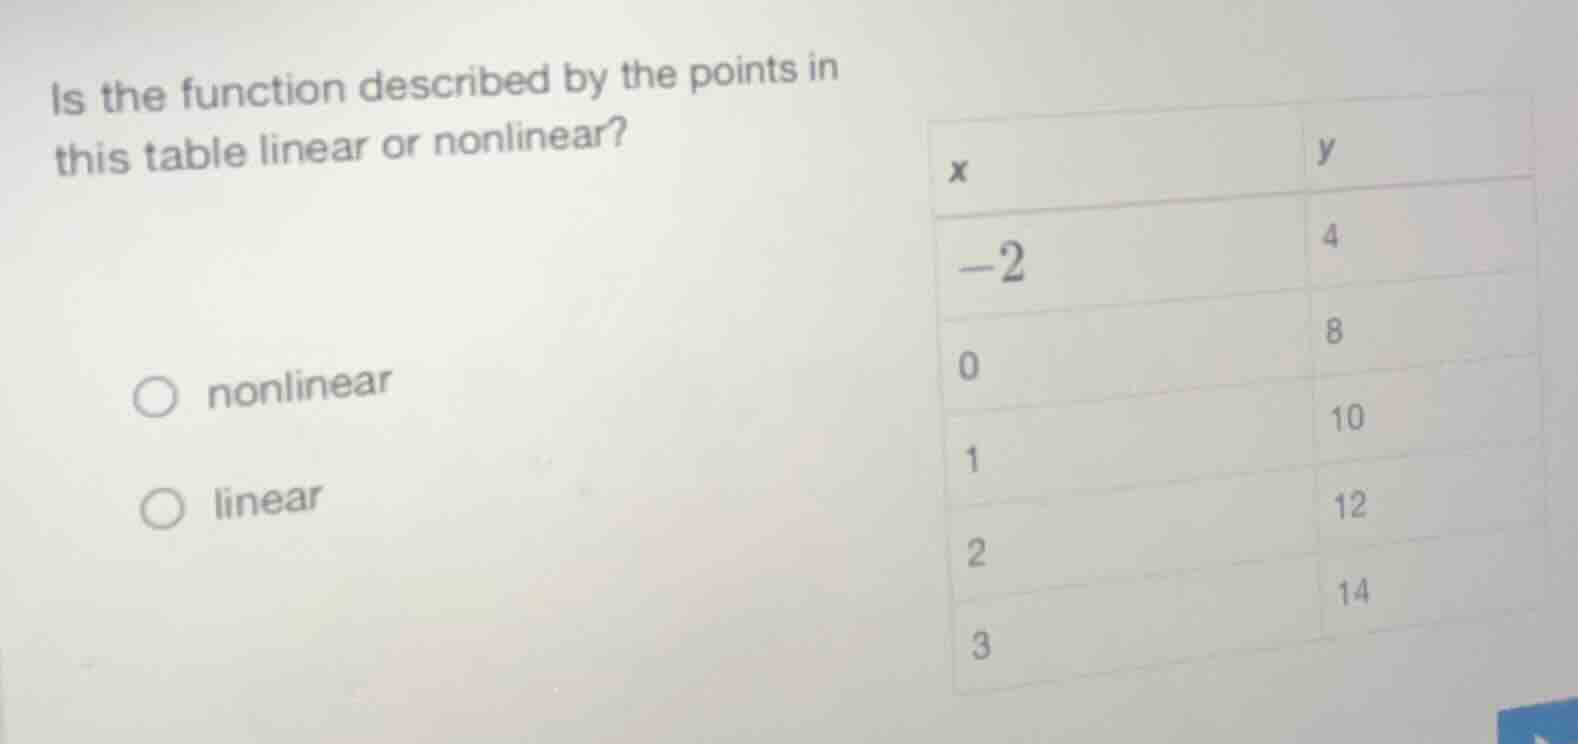
is the function described by the points in this table linear or nonlinear?
options:
○ nonlinear
○ linear
table:
| x | y |
| -2 | 4 |
| 0 | 8 |
| 1 | 10 |
| 2 | 12 |
| 3 | 14 |
Step1: Calculate the rate of change (slope) between consecutive points.
The formula for the slope \( m \) between two points \( (x_1, y_1) \) and \( (x_2, y_2) \) is \( m=\frac{y_2 - y_1}{x_2 - x_1} \).
First, between \( (-2, 4) \) and \( (0, 8) \):
\( m_1=\frac{8 - 4}{0 - (-2)}=\frac{4}{2} = 2 \)
Second, between \( (0, 8) \) and \( (1, 10) \):
\( m_2=\frac{10 - 8}{1 - 0}=\frac{2}{1}=2 \)
Third, between \( (1, 10) \) and \( (2, 12) \):
\( m_3=\frac{12 - 10}{2 - 1}=\frac{2}{1}=2 \)
Fourth, between \( (2, 12) \) and \( (3, 14) \):
\( m_4=\frac{14 - 12}{3 - 2}=\frac{2}{1}=2 \)
Step2: Analyze the slopes.
Since the slope between each pair of consecutive points is constant (\( m = 2 \) for all pairs), the function has a constant rate of change. A function with a constant rate of change is a linear function.

Snap & solve any problem in the app
Get step-by-step solutions on Sovi AI
Photo-based solutions with guided steps
Explore more problems and detailed explanations
linear