QUESTION IMAGE
Question
future of space exploration, 50 years\
\
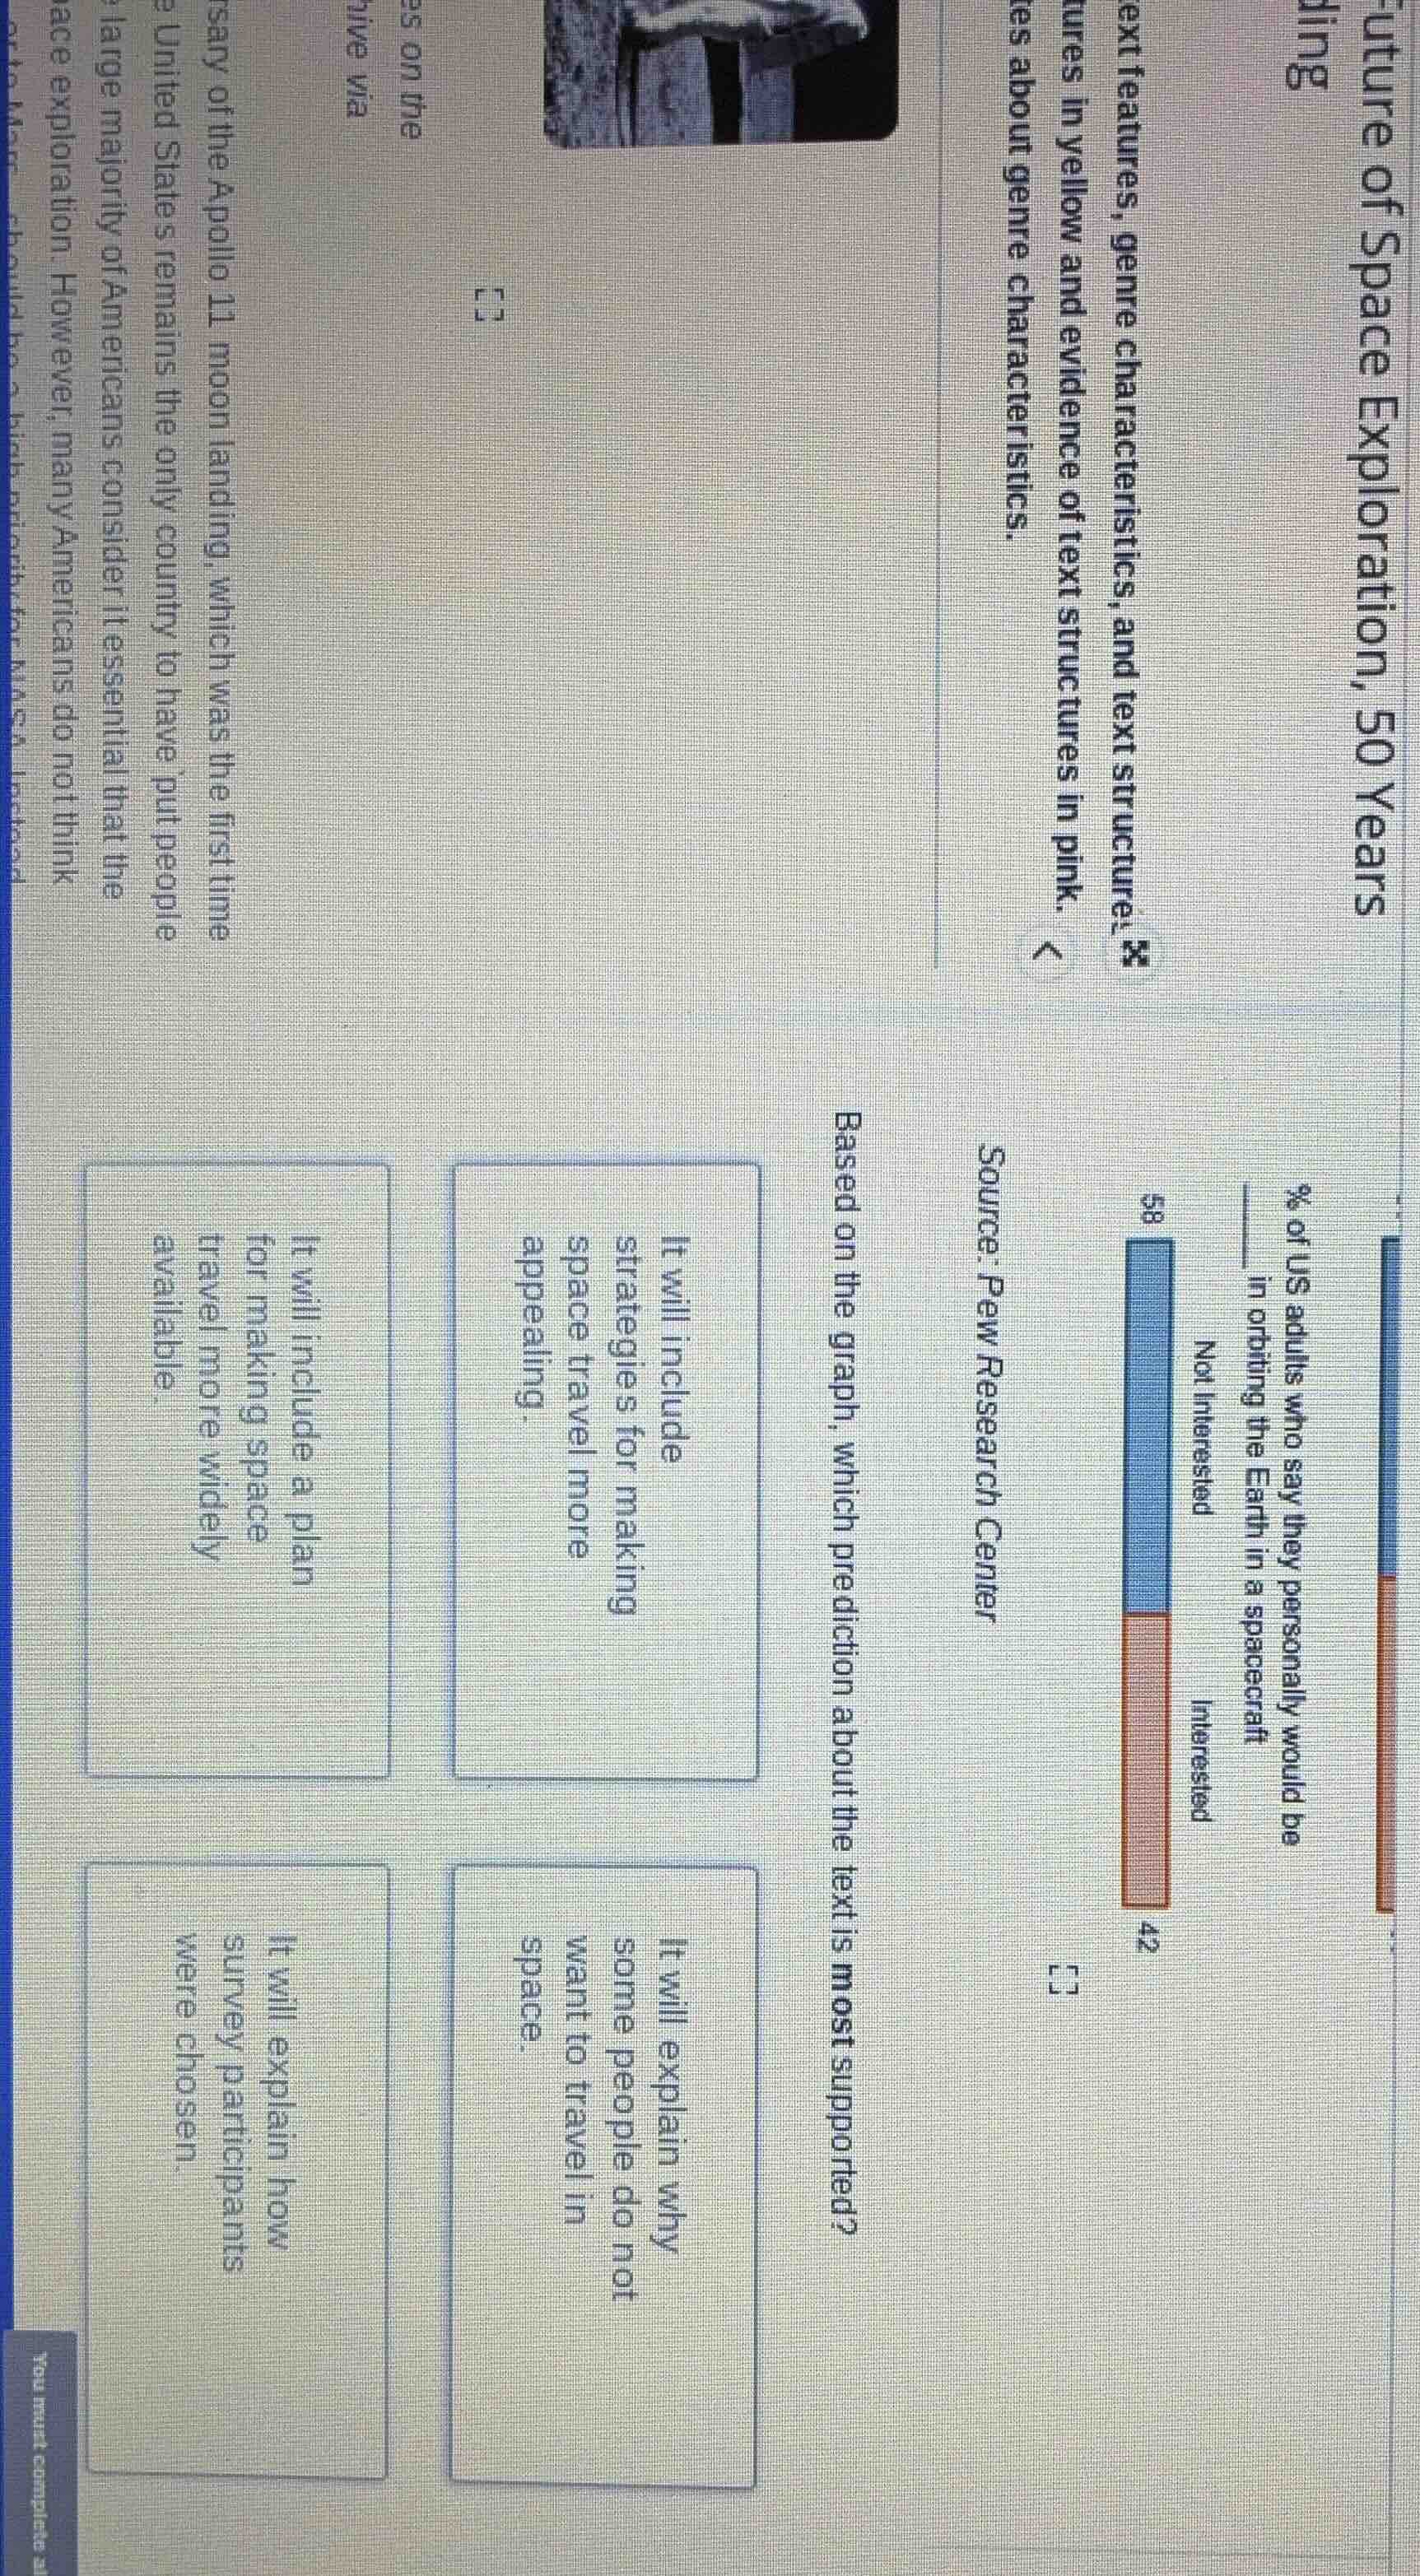
% of us adults who say they personally would be\
____ in orbiting the earth in a spacecraft\
\
source: pew research center\
based on the graph, which prediction about the text is most supported?\
\
it will include strategies for making space travel more appealing.\
it will include a plan for making space travel more widely available.\
it will explain why some people do not want to travel in space.\
it will explain how survey participants were chosen.\
\
(and other text about apollo 11 moon landing and space exploration opinions)
To solve this, we analyze the graph (58% Not Interested, 42% Interested in space travel) and the options:
- Option 1: Talks about making space travel appealing. The graph shows interest levels, not strategies for appeal. Eliminate.
- Option 2: Talks about a plan for wider space travel availability. The graph is about interest, not plans for availability. Eliminate.
- Option 3: Explains why some people do not want to travel in space. The graph shows 58% are not interested, so the text could explain this (e.g., reasons behind low interest). This aligns.
- Option 4: Explains how survey participants were chosen. The graph is about interest results, not sampling methods. Eliminate.
The graph shows 58% of US adults are not interested in space travel. The option "It will explain why some people do not want to travel in space" aligns with analyzing this interest (or lack thereof) data. Other options focus on strategies, plans, or survey methods, which the graph does not support.

Snap & solve any problem in the app
Get step-by-step solutions on Sovi AI
Photo-based solutions with guided steps
Explore more problems and detailed explanations
It will explain why some people do not want to travel in space.