QUESTION IMAGE
Question
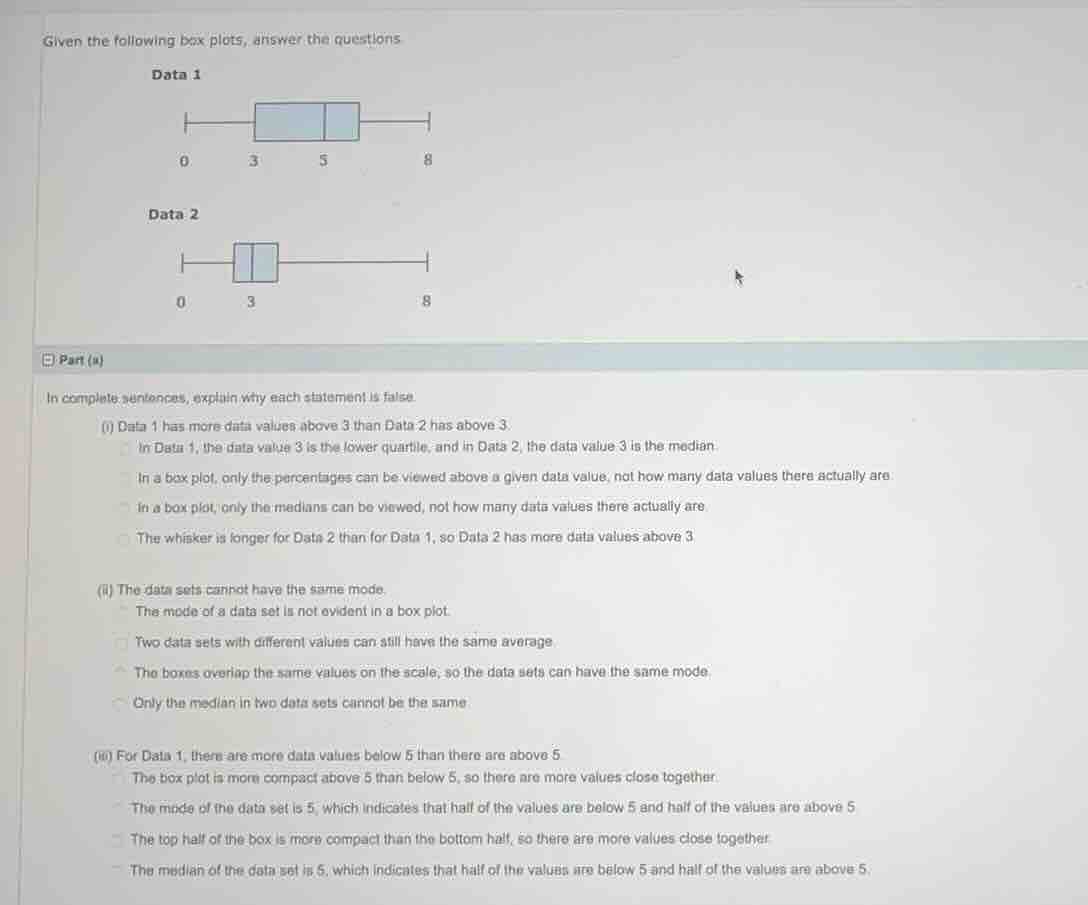
given the following box plots, answer the questions.
data 1
box plot with minimum 0, lower quartile 3, median 5, upper quartile (not fully shown), maximum 8
data 2
box plot with minimum 0, lower quartile (not fully shown), median 3, upper quartile (not fully shown), maximum 8
part (a)
in complete sentences, explain why each statement is false.
(i) data 1 has more data values above 3 than data 2 has above 3.
- in data 1, the data value 3 is the lower quartile, and in data 2, the data value 3 is the median.
- in a box plot, only the percentages can be viewed above a given data value, not how many data values there actually are
- in a box plot, only the medians can be viewed, not how many data values there actually are
- the whisker is longer for data 2 than for data 1, so data 2 has more data values above 3
(ii) the data sets cannot have the same mode.
- the mode of a data set is not evident in a box plot.
- two data sets with different values can still have the same average
- the boxes overlap the same values on the scale, so the data sets can have the same mode.
- only the median in two data sets cannot be the same
(iii) for data 1, there are more data values below 5 than there are above 5
- the box plot is more compact above 5 than below 5, so there are more values close together
- the mode of the data set is 5, which indicates that half of the values are below 5 and half of the values are above 5
- the top half of the box is more compact than the bottom half, so there are more values close together
- the median of the data set is 5, which indicates that half of the values are below 5 and half of the values are above 5
Part (a) (i)
To determine why the statement "Data 1 has more data values above 3 than Data 2 has above 3" is false, we analyze box - plot properties. A box - plot shows the distribution of data in terms of quartiles (percentiles) and the range of the data (whiskers), but it does not provide information about the actual number of data points. So, we can't tell from a box - plot how many data values are above a particular value like 3. The option "In a box plot, only the percentages can be viewed above a given data value, not how many data values there actually are" is correct because box - plots represent the proportion (percentage) of data in different regions (e.g., below the lower quartile, between quartiles, above the upper quartile) rather than the absolute number of data points.
The statement "The data sets cannot have the same mode" is false. The mode of a data set is the most frequently occurring value. A box - plot is used to show the spread (range, inter - quartile range) and the median of the data. It does not display information about the frequency of individual data points, so we cannot tell the mode from a box - plot. This means that two data sets represented by different box - plots could potentially have the same mode. The option "The mode of a data set is not evident in a box plot" is correct.
The statement "For Data 1, there are more data values below 5 than there are above 5" is false. In a box - plot, the median is the line inside the box. For Data 1, the median is 5. By the definition of the median, it is the middle value of a data set (or the average of the two middle values for an even - numbered data set). This means that half of the data values are below the median and half are above the median. So, the number of data values below 5 (the median) is equal to the number of data values above 5. The option "The median of the data set is 5, which indicates that half of the values are below 5 and half of the values are above 5" is correct.

Snap & solve any problem in the app
Get step-by-step solutions on Sovi AI
Photo-based solutions with guided steps
Explore more problems and detailed explanations
In a box plot, only the percentages can be viewed above a given data value, not how many data values there actually are