QUESTION IMAGE
Question
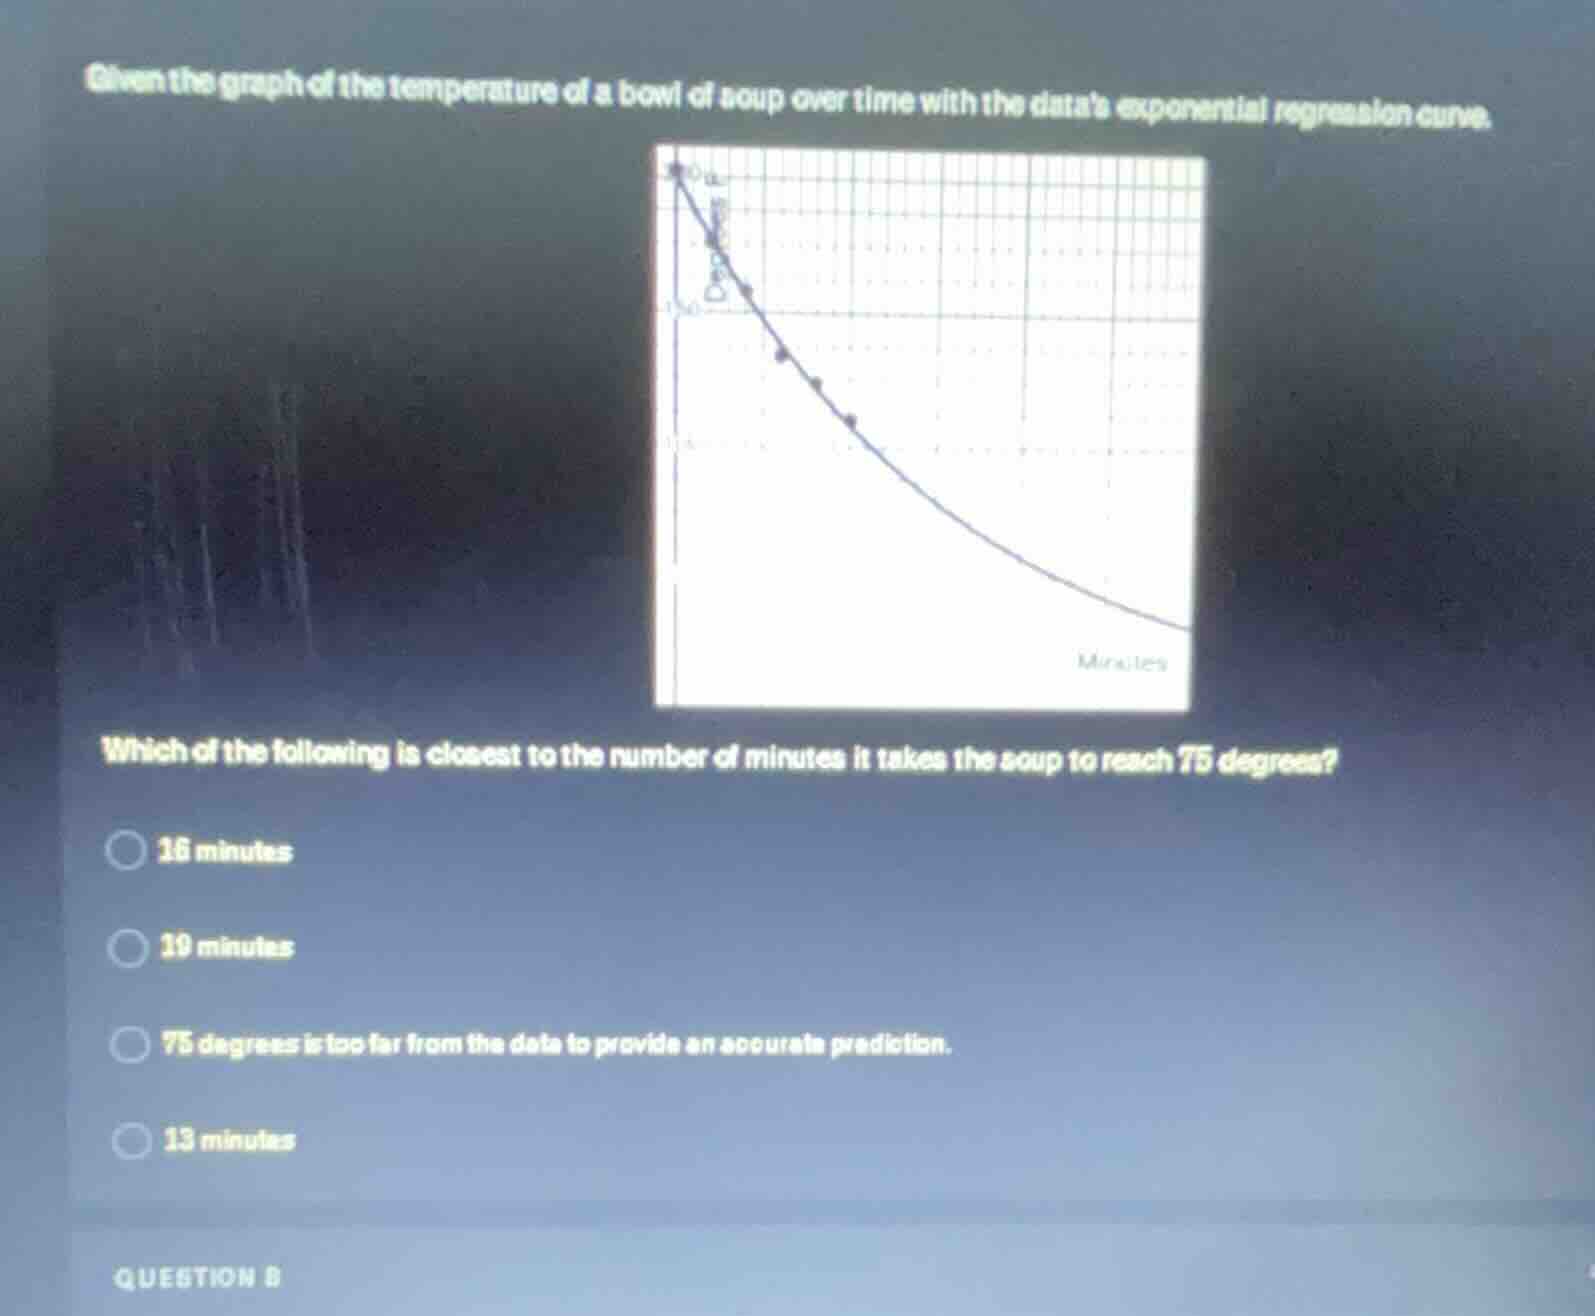
given the graph of the temperature of a bowl of soup over time with the datas exponential regression curve. which of the following is closest to the number of minutes it takes the soup to reach 75 degrees? 16 minutes 19 minutes 75 degrees is too far from the data to provide an accurate prediction. 13 minutes question 8
The exponential regression curve shows the soup's cooling trend. The plotted data points are clustered at higher temperatures (near the start of the time axis), and 75 degrees is much lower than the visible data range. Extrapolating this far beyond the existing data would not yield an accurate prediction.

Snap & solve any problem in the app
Get step-by-step solutions on Sovi AI
Photo-based solutions with guided steps
Explore more problems and detailed explanations
75 degrees is too far from the data to provide an accurate prediction.