QUESTION IMAGE
Question
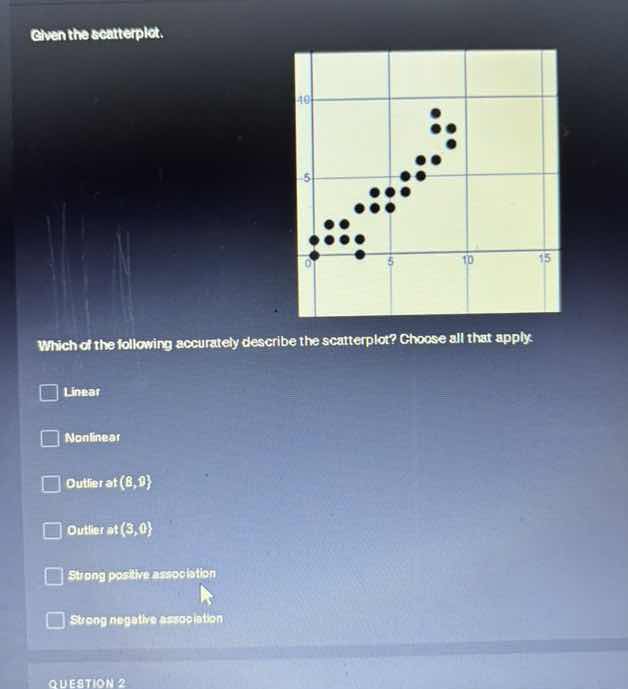
given the scatterplot.
which of the following accurately describe the scatterplot? choose all that apply.
linear
nonlinear
outlier at (8, 8)
outlier at (3, 0)
strong positive association
strong negative association
question 2
Brief Explanations
- Linear: The points follow a roughly straight upward trend, so the relationship is linear.
- Nonlinear: The trend is straight, not curved, so this does not apply.
- Outlier at (8,0): There is no point at (8,0); the low point is at (3,0).
- Outlier at (3,0): This point lies far below the general upward trend of the other points, making it an outlier.
- Strong positive association: The points cluster closely along an upward-sloping line, indicating a strong positive linear relationship.
- Strong negative association: The trend is upward, not downward, so this does not apply.

Snap & solve any problem in the app
Get step-by-step solutions on Sovi AI
Photo-based solutions with guided steps
Explore more problems and detailed explanations
Linear, Outlier at (3,0), Strong positive association