QUESTION IMAGE
Question
gráficando las mareas
en esta actividad trazarás los datos de mareas de un mes
y utilizarás el gráfico resultante para responder preguntas.
- examinar la tabla de datos de mareas en el fondo
de esta hoja. encuentra la marea alta más alta y la
marea baja más baja del mes. ¿cuál es la
diferencia entre estas dos alturas?
- utilice los datos para trazar la tendencia de las
mareas altas. págamecha la altura de todas las
mareas altas y conecta los puntos. traza esta
línea con un lápiz o bolígrafo de color rojo.
- utilice los datos para trazar la tendencia de las
mareas bajas. traza la altura de todas las mareas
bajas y conecta los puntos. traza esta línea con un lápiz o bolígrafo de color azul.
- responda las preguntas de análisis
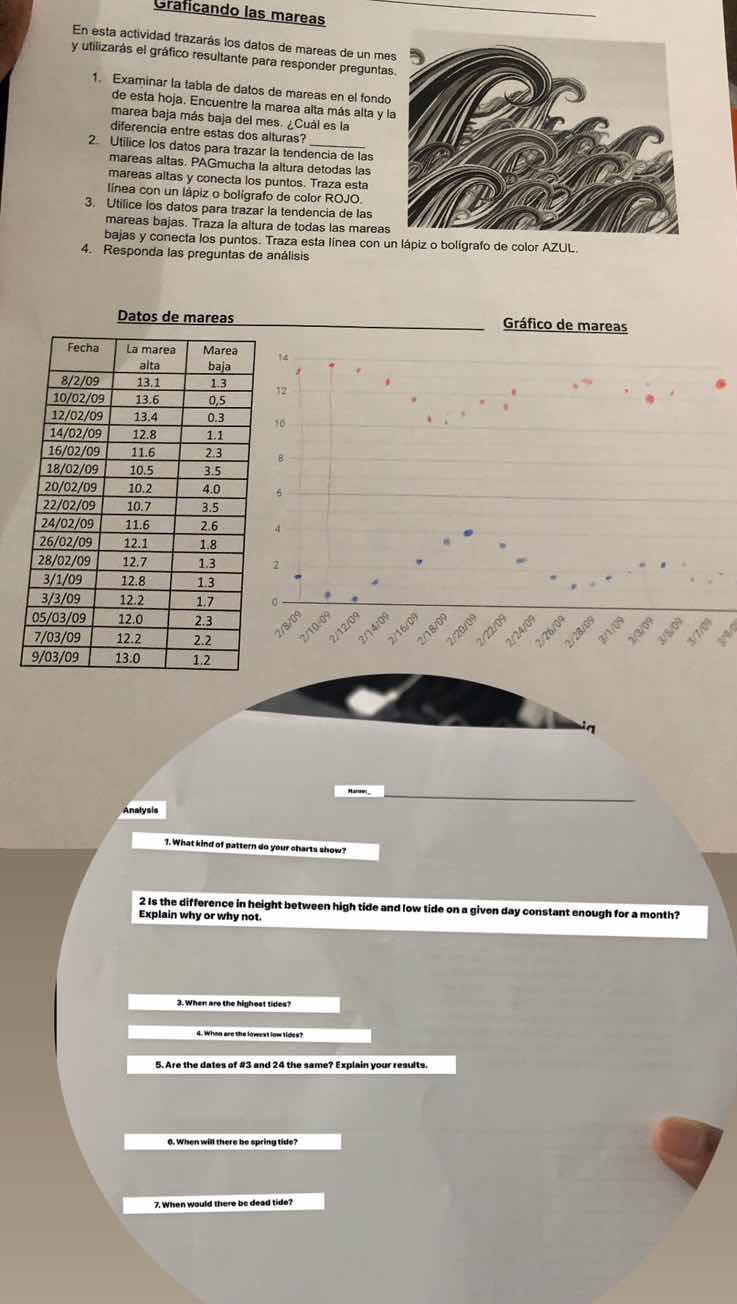
datos de mareas
gráfico de mareas
fecha\tla marea alta\tmarea baja
8/2/09\t13.1\t1.3
10/02/09\t13.6\t0.5
12/02/09\t13.4\t0.3
14/02/09\t12.8\t1.1
16/02/09\t11.6\t2.3
18/02/09\t10.5\t4.0
20/02/09\t10.2\t3.5
22/02/09\t10.7\t3.5
24/02/09\t11.6\t2.6
26/02/09\t12.1\t1.8
28/02/09\t12.7\t1.3
31/01/09\t12.8\t1.3
3/3/09\t12.2\t1.7
05/03/09\t12.0\t2.3
7/03/09\t12.2\t2.2
9/03/09\t13.0\t1.2
análisis
- what kind of pattern do your charts show?
- is the difference in height between high tide and low tide on a given day constant enough for a month?
explain why or why not.
- when are the highest tides?
- when are the lowest low tides?
- are the dates of #3 and 24 the same? explain your results.
- when will there be spring tide?
- when would there be dead tide?
1. What kind of pattern do your charts show?
For high tides (red points), the heights fluctuate: they increase, then decrease, and then increase again over the month. For low tides (blue points), the heights also fluctuate, with some periods of increase and decrease. Overall, both high and low tides show a cyclical or oscillating pattern, likely related to lunar and solar influences on tides.
To find the tidal range (difference between high and low tide) for each day, we calculate:
- 8/2/09: \( 13.1 - 1.3 = 11.8 \)
- 10/02/09: \( 13.6 - 0.5 = 13.1 \)
- 12/02/09: \( 13.4 - 0.3 = 13.1 \)
- 14/02/09: \( 12.8 - 1.1 = 11.7 \)
- 16/02/09: \( 11.6 - 2.3 = 9.3 \)
- 18/02/09: \( 10.5 - 4.0 = 6.5 \)
- 20/02/09: \( 10.2 - 3.5 = 6.7 \)
- 22/02/09: \( 10.7 - 3.5 = 7.2 \)
- 24/02/09: \( 11.6 - 2.6 = 9.0 \)
- 26/02/09: \( 12.1 - 1.8 = 10.3 \)
- 28/02/09: \( 12.7 - 1.3 = 11.4 \)
- 3/1/09: \( 12.8 - 1.3 = 11.5 \)
- 3/3/09: \( 12.2 - 1.7 = 10.5 \)
- 05/03/09: \( 12.0 - 2.3 = 9.7 \)
- 7/03/09: \( 12.2 - 2.2 = 10.0 \)
- 9/03/09: \( 13.0 - 1.2 = 11.8 \)
The tidal ranges vary significantly (from 6.5 to 13.1). This is because tides are influenced by the Moon’s position (lunar cycle), Earth’s rotation, and solar gravity, leading to changing gravitational pulls and thus variable tidal ranges.
Looking at the "La marea alta" column, the highest high tide values are on 10/02/09 (13.6), 12/02/09 (13.4), and 9/03/09 (13.0). Among these, 10/02/09 has the highest high tide (13.6).

Snap & solve any problem in the app
Get step-by-step solutions on Sovi AI
Photo-based solutions with guided steps
Explore more problems and detailed explanations
The charts show a cyclical (oscillating) pattern for both high and low tides, with fluctuations in height over the month.