QUESTION IMAGE
Question
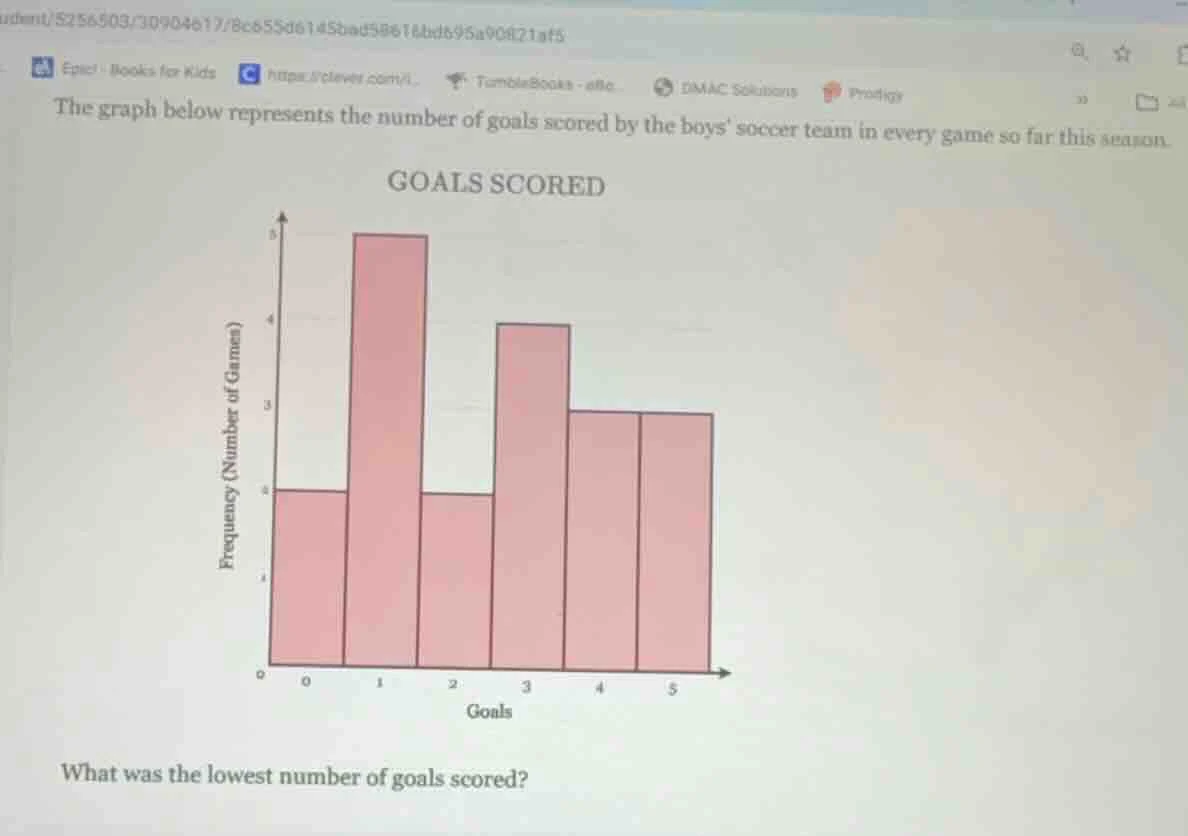
the graph below represents the number of goals scored by the boys soccer team in every game so far this season.
goals scored
bar graph with x - axis labeled goals (0,1,2,3,4,5) and y - axis labeled frequency (number of games)
what was the lowest number of goals scored?
Step1: Analyze the x - axis of the bar graph
The x - axis of the bar graph represents the number of goals scored, with values 0, 1, 2, 3, 4, 5.
Step2: Determine the lowest value
Among the values 0, 1, 2, 3, 4, 5 on the x - axis (representing goals scored), the smallest value is 0.

Snap & solve any problem in the app
Get step-by-step solutions on Sovi AI
Photo-based solutions with guided steps
Explore more problems and detailed explanations
0