QUESTION IMAGE
Question
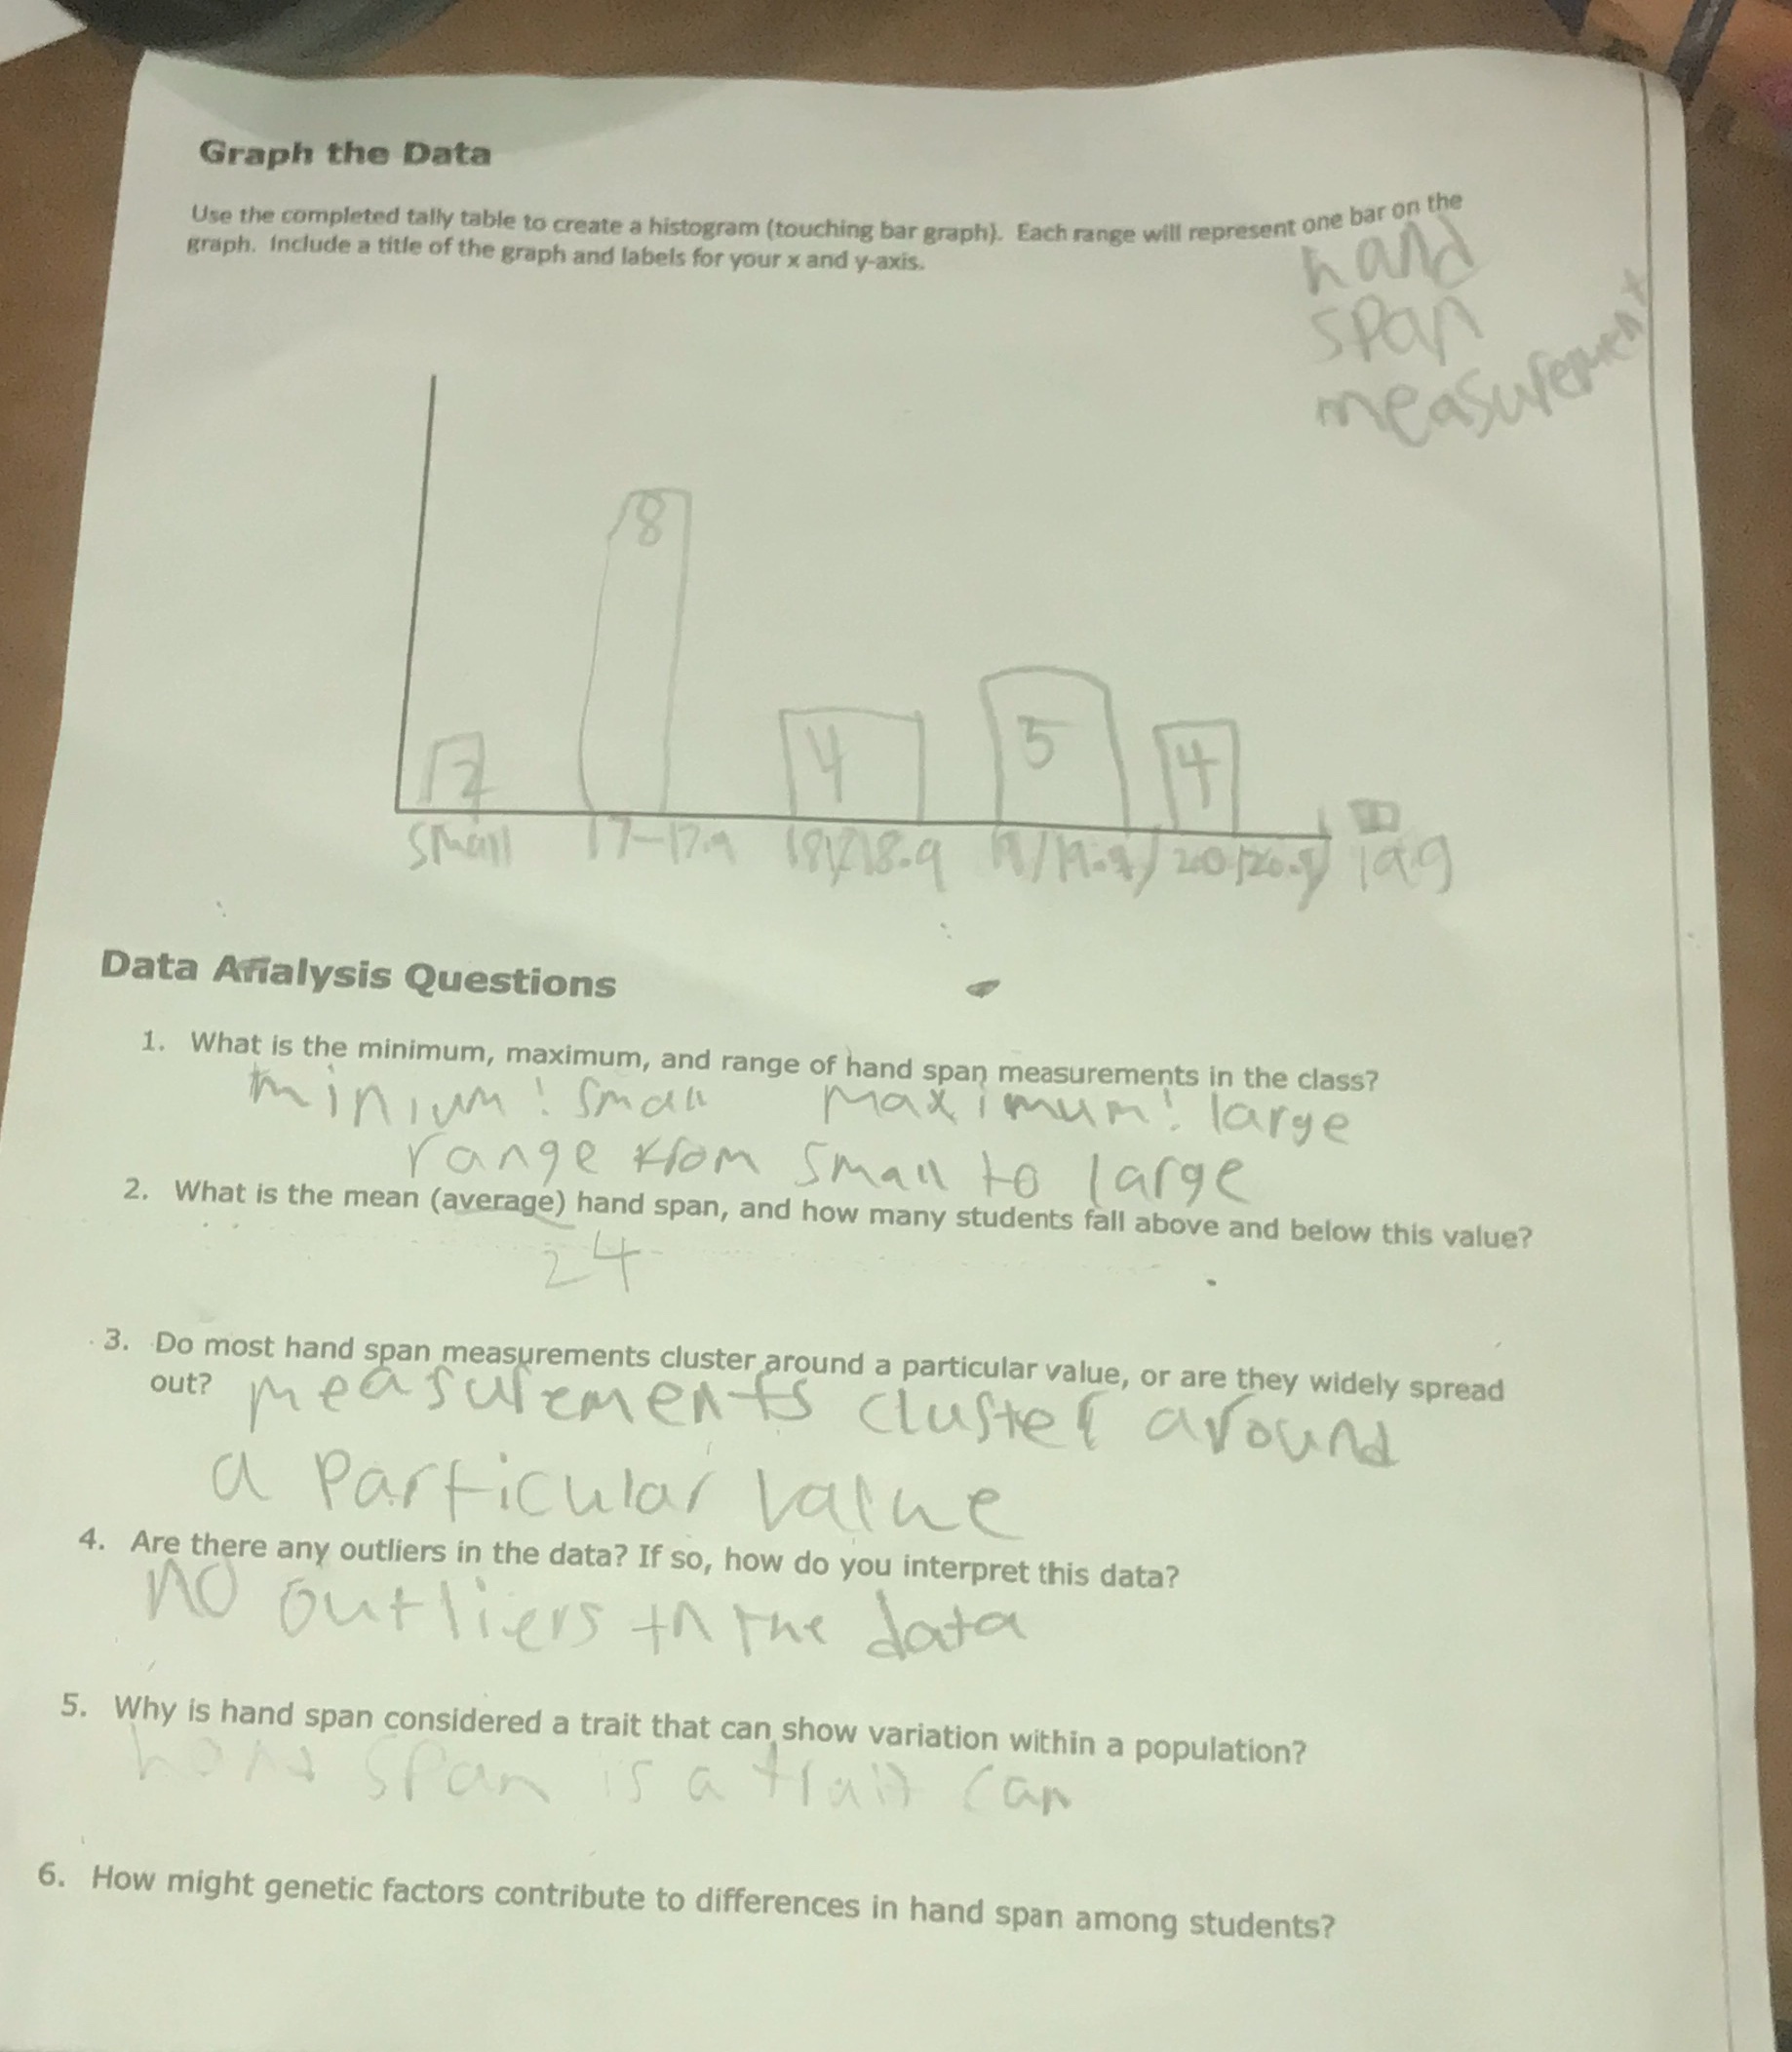
graph the data
use the completed tally table to create a histogram (touching bar graph). each range will represent one bar on the graph. include a title of the graph and labels for your x and y - axis.
data analysis questions
- what is the minimum, maximum, and range of hand span measurements in the class?
- what is the mean (average) hand span, and how many students fall above and below this value?
- do most hand span measurements cluster around a particular value, or are they widely spread out?
- are there any outliers in the data? if so, how do you interpret this data?
- why is hand span considered a trait that can show variation within a population?
- how might genetic factors contribute to differences in hand span among students?
Question 1
Step1: Identify Minimum
The smallest category is "Small", so minimum hand span category is Small.
Step2: Identify Maximum
The largest category is "Large", so maximum hand span category is Large.
Step3: Calculate Range
Range is max - min (in terms of categories, from Small to Large).
Step1: Total Students
Sum the counts: \( 2 + 8 + 4 + 5 + 4 = 23 \)
Step2: Sum of Hand Span (using midpoints, assume Small = 16, 17 - 17.9 midpoint = 17.45, 18 - 18.9 = 18.45, 19 - 19.9 = 19.45, 20 - 20.9 = 20.45)
\( (16\times2)+(17.45\times8)+(18.45\times4)+(19.45\times5)+(20.45\times4) \)
\( = 32 + 139.6 + 73.8 + 97.25 + 81.8 \)
\( = 32 + 139.6 = 171.6; 171.6 + 73.8 = 245.4; 245.4 + 97.25 = 342.65; 342.65 + 81.8 = 424.45 \)
Step3: Mean
Mean \( = \frac{424.45}{23} \approx 18.45 \)
Step4: Students Above and Below
Count students with hand span > 18.45: 5 + 4 = 9; students with hand span < 18.45: 2 + 8 + 4 = 14 (adjust based on exact midpoints, but using counts: above mean (18.45) are 19 - 19.9 (5) and 20 - 20.9 (4), below are Small (2), 17 - 17.9 (8), 18 - 18.9 (4)).
Looking at the histogram counts (2, 8, 4, 5, 4), the count 8 is the highest, so most measurements cluster around the 17 - 17.9 range (the category with count 8).

Snap & solve any problem in the app
Get step-by-step solutions on Sovi AI
Photo-based solutions with guided steps
Explore more problems and detailed explanations
Minimum: Small, Maximum: Large, Range: From Small to Large (categories)
Question 2
First, we need to find the total number of students and the sum of hand span values (assuming the counts are 2, 8, 4, 5, 4 for categories Small, 17 - 17.9, 18 - 18.9, 19 - 19.9, 20 - 20.9).