QUESTION IMAGE
Question
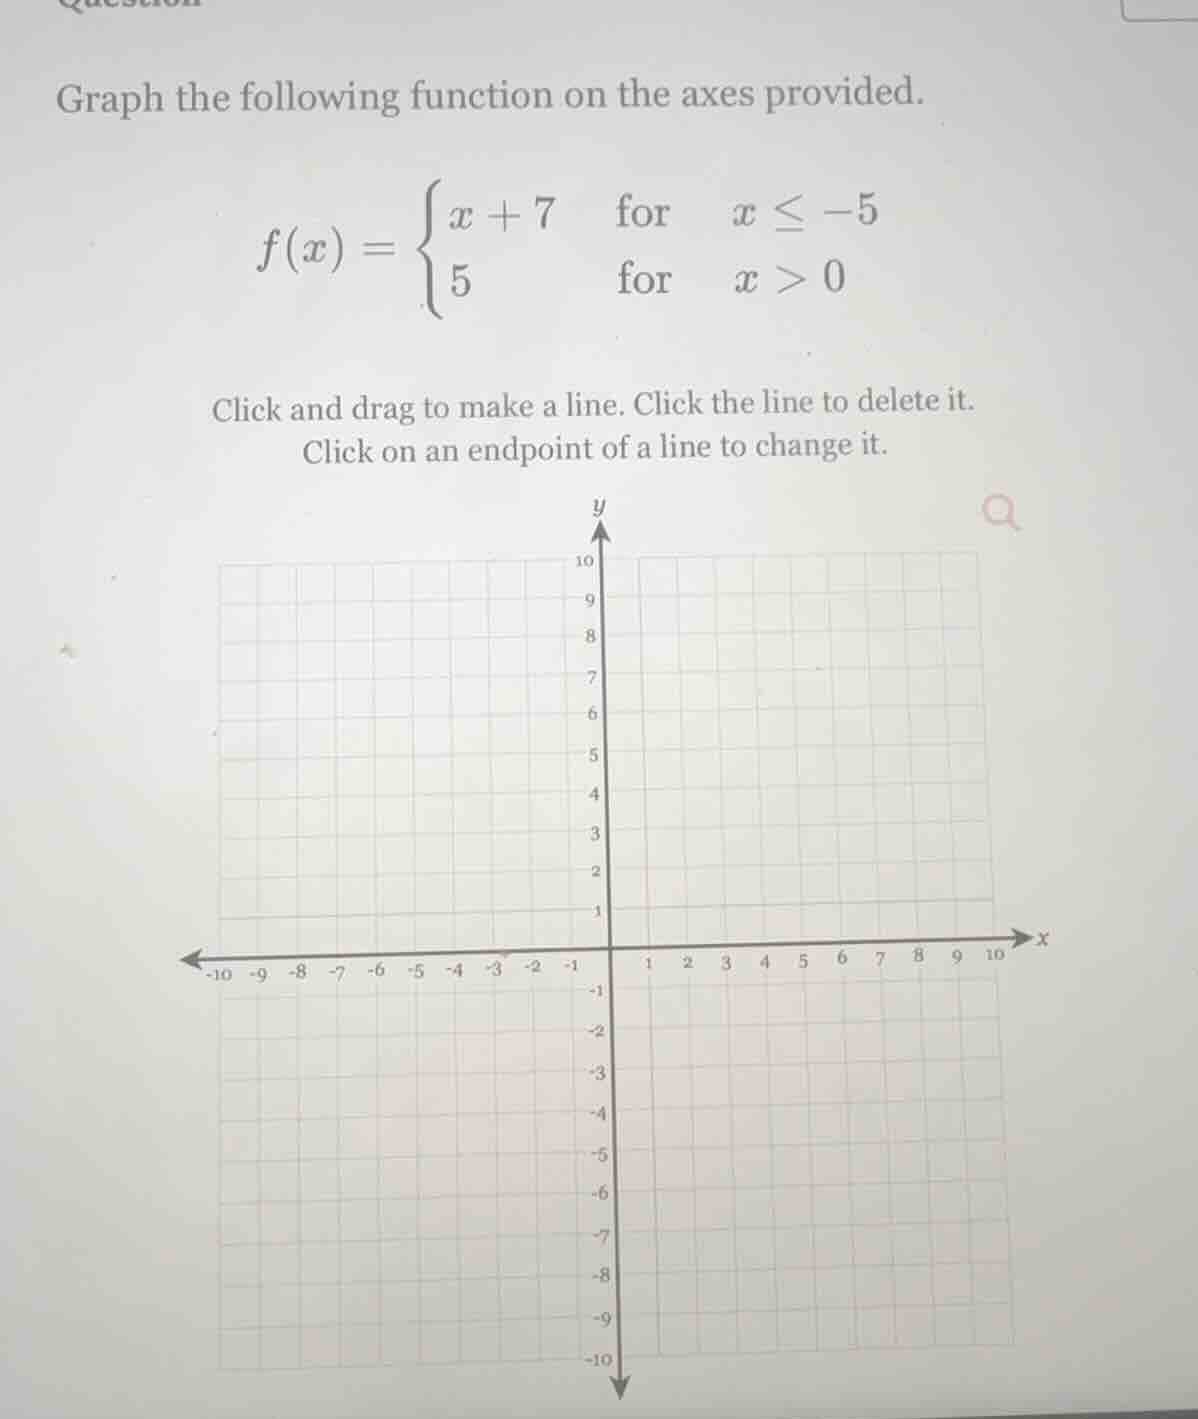
graph the following function on the axes provided.
$f(x) = \
$
click and drag to make a line. click the line to delete it.
click on an endpoint of a line to change it.
graph axes with x from -10 to 10 and y from -10 to 10
Step1: Graph \( y = x + 7 \) for \( x \leq -5 \)
First, find the endpoint at \( x = -5 \). Substitute \( x = -5 \) into \( y = x + 7 \): \( y = -5 + 7 = 2 \). So the point is \( (-5, 2) \). Then, choose another point for \( x < -5 \), e.g., \( x = -10 \), \( y = -10 + 7 = -3 \), so the point is \( (-10, -3) \). Draw a line through \( (-10, -3) \) and \( (-5, 2) \), with a closed dot at \( (-5, 2) \) (since \( x \leq -5 \)).
Step2: Graph \( y = 5 \) for \( x > 0 \)
This is a horizontal line. Choose two points with \( x > 0 \), e.g., \( x = 1 \), \( y = 5 \) and \( x = 10 \), \( y = 5 \). Draw a horizontal line through these points, with an open dot at \( (0, 5) \) (since \( x > 0 \)) and extend to the right.

Snap & solve any problem in the app
Get step-by-step solutions on Sovi AI
Photo-based solutions with guided steps
Explore more problems and detailed explanations
To graph the piecewise function:
- For \( f(x) = x + 7 \) ( \( x \leq -5 \) ): Plot \( (-5, 2) \) (closed dot) and \( (-10, -3) \), draw a line through them.
- For \( f(x) = 5 \) ( \( x > 0 \) ): Plot \( (1, 5) \) (open dot at \( (0, 5) \)) and \( (10, 5) \), draw a horizontal line through them.
(Note: The graphing is done by clicking/dragging on the provided axes as per the interface instructions.)