QUESTION IMAGE
Question
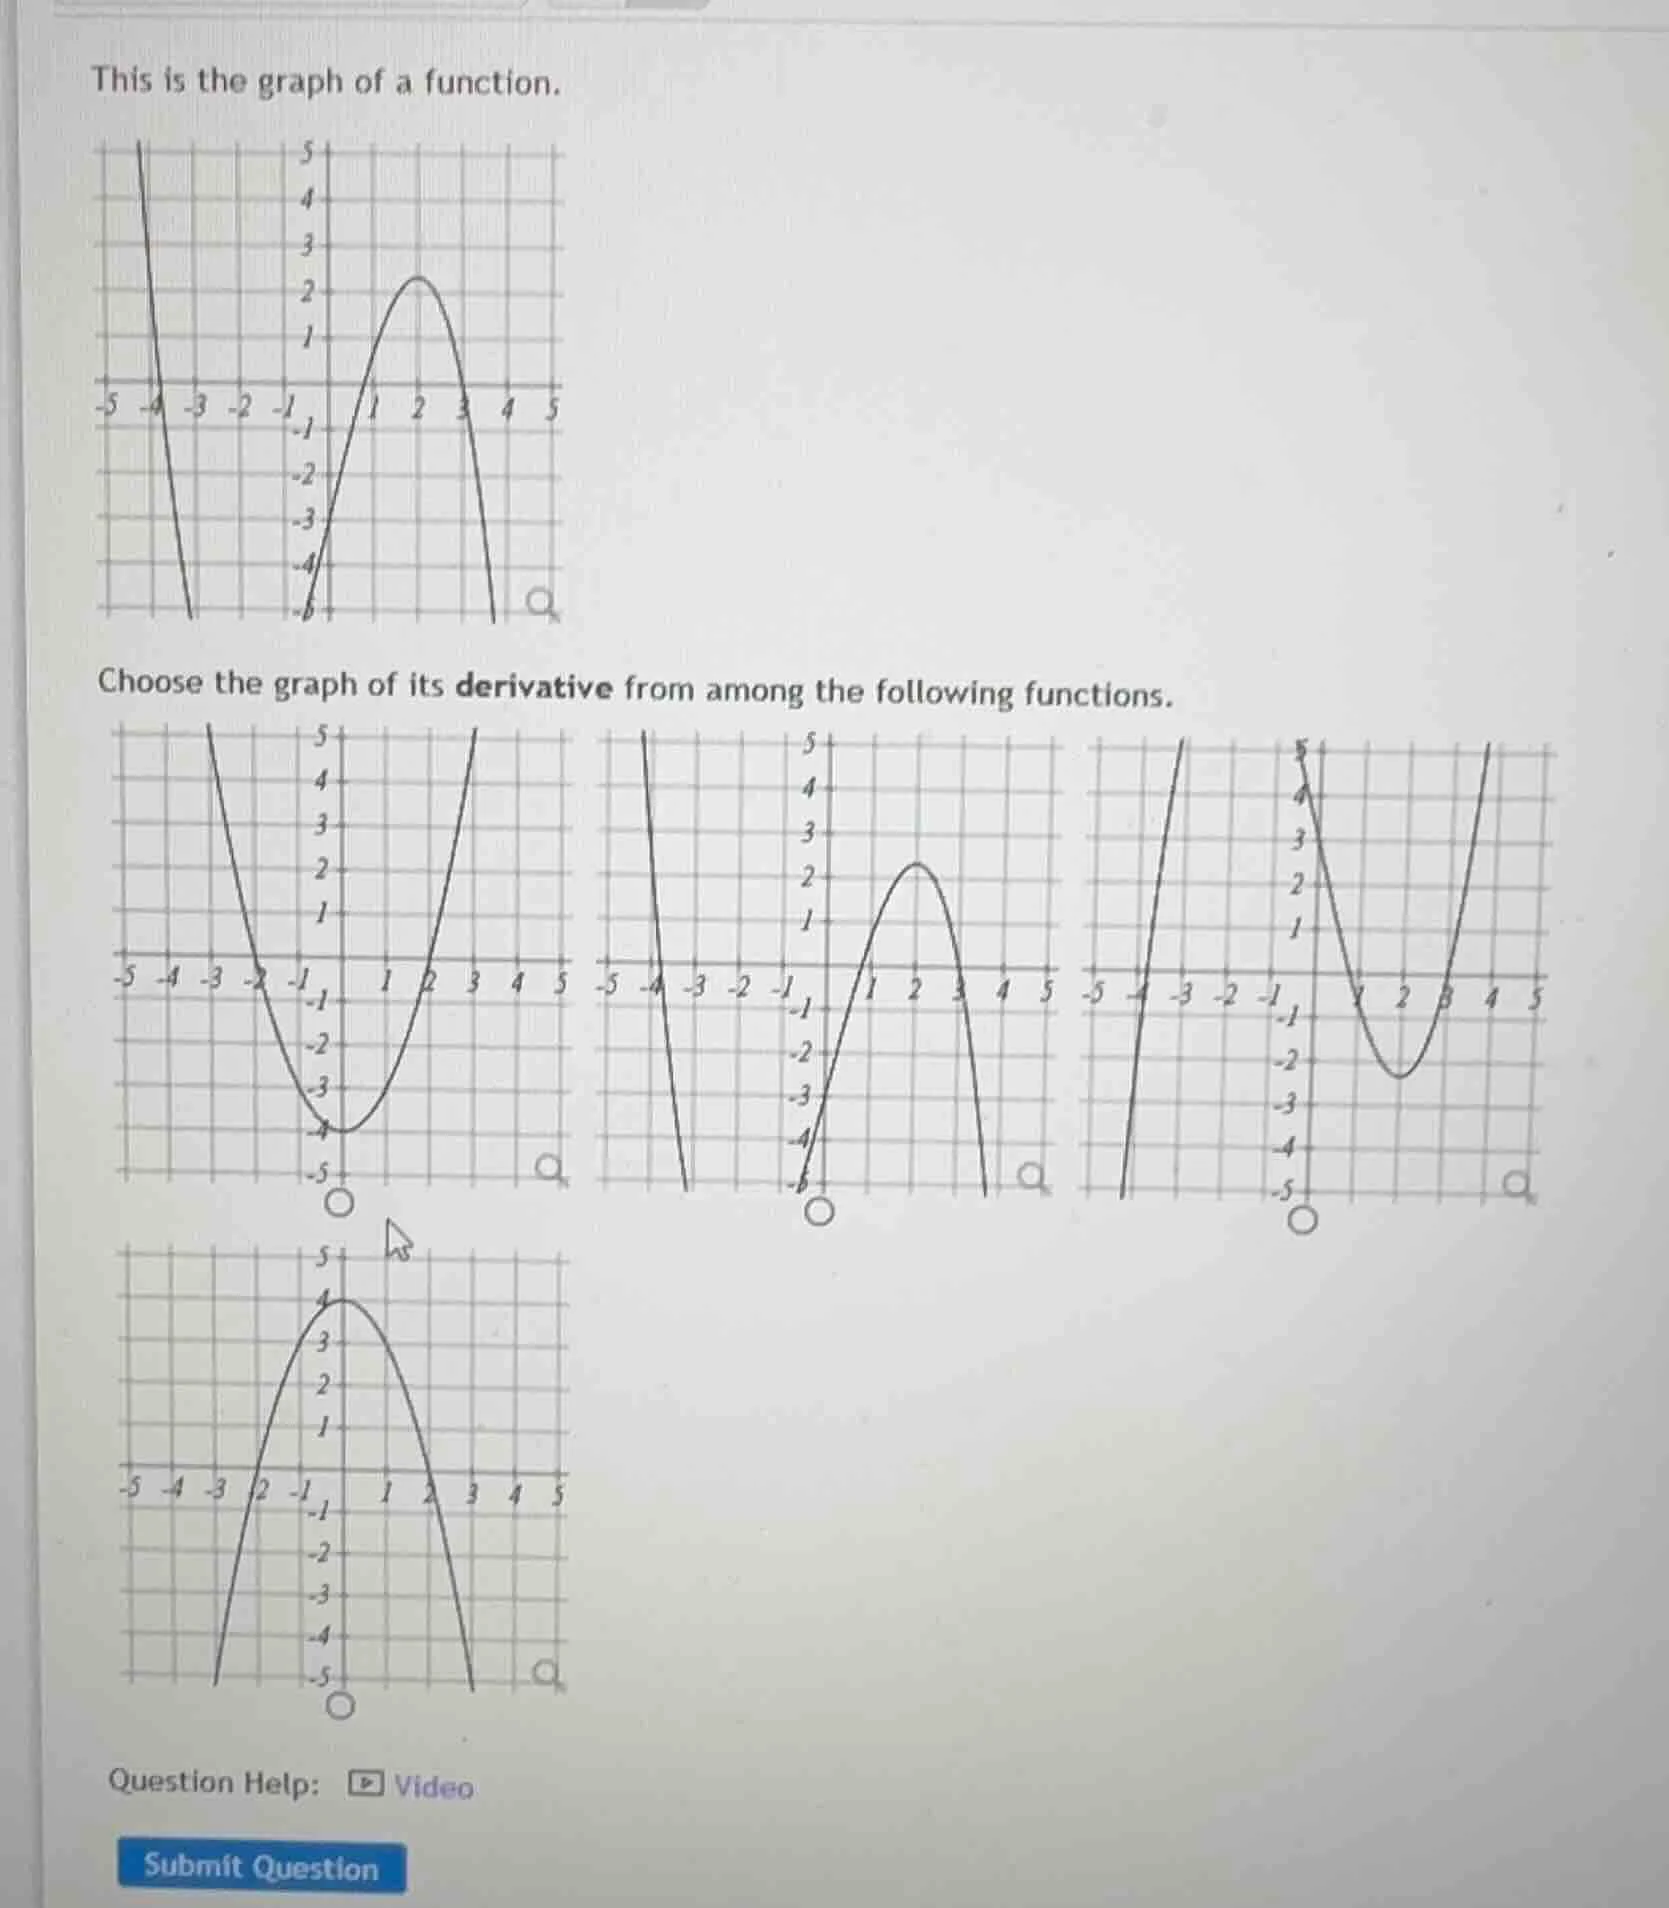
this is the graph of a function.
choose the graph of its derivative from among the following functions.
question help:
video
submit question
Step1: Analyze the original function's graph
The original function has a local maximum at \( x = 2 \) (since the graph reaches a peak there) and a local minimum? Wait, no, looking at the original graph: on the left, it comes from the top left, goes down, then on the right side of \( x = 0 \), it rises to a peak at \( x = 2 \), then falls. Also, the left part (for \( x < - 4 \) maybe?) and the right part (for \( x > 3 \)) go down. Wait, actually, the original function's derivative will tell us about the slope.
- When the original function is decreasing (slope negative), the derivative is negative.
- When the original function is increasing (slope positive), the derivative is positive.
- At the peak (local maximum) of the original function (at \( x = 2 \)), the derivative should be zero (horizontal tangent).
- Let's track the slope:
- For \( x < - 4 \): The original function is decreasing (going down as \( x \) increases towards -4), so derivative is negative.
- Between \( - 4 \) and \( 2 \): Wait, no, looking at the original graph: from \( x = - 5 \) to \( x = 2 \), wait, no, the graph on the left (left of \( x = 0 \)): at \( x = - 4 \), it crosses the x-axis, then goes down to a minimum? Wait, maybe better to look at the critical points. The original function has a local maximum at \( x = 2 \) (where the slope is zero, derivative zero). Also, let's see the behavior:
- As \( x \) approaches \( -\infty \), the original function is decreasing (slope negative), then at some point (left of \( x = - 4 \)) it starts decreasing? Wait, maybe the original function is a cubic-like? No, the original graph: left side (x < -4) is decreasing (slope negative), then between -4 and 2, wait, no, the graph on the right of x=0: from x=0 to x=2, it's increasing (slope positive), then from x=2 to x=4, it's decreasing (slope negative). Also, on the left of x=0: from x=-5 to x=0, the function is decreasing (slope negative) until some point, then? Wait, maybe I messed up. Let's look at the derivative graphs.
Wait, the bottom - most graph (the last one, the fourth option) is a parabola opening downward, with roots at x = -2 and x = 2? Wait, no, the fourth graph (the one with peak at x=0, crossing x-axis at x=-2 and x=2). Wait, no, let's check the options:
First option: a parabola opening upward, with vertex at (0, -4), crossing x-axis at x=-2 and x=2.
Second option: same as original graph? No, second option looks like the original graph but maybe shifted? No, second option has a peak at x=2, similar to original.
Third option: a parabola opening upward, with vertex at (2, -2), crossing x-axis at x=1 and x=3? Wait, no, third option: on the left, it's increasing (slope positive) for x < -4, then decreasing, then increasing? Wait, no.
Fourth option: a parabola opening downward, with vertex at (0, 4), crossing x-axis at x=-2 and x=2.
Wait, let's think about the original function's derivative:
Original function:
- For \( x < - 4 \): decreasing (slope negative) → derivative negative.
- Between \( - 4 \) and \( 2 \): Wait, no, at x=0, the original function has a slope (derivative) that is positive? Wait, at x=0, the original graph is going up (from x=0 to x=2, it's increasing), so slope at x=0 is positive. Wait, maybe the original function's derivative is a quadratic function (parabola) opening downward, because the original function has a single local maximum (at x=2) and maybe a local minimum? Wait, no, the original graph: left side (x < -4) is decreasing, then between -4 and 2, is it increasing? Wait, at x=-4, the original graph crosses the x-axi…

Snap & solve any problem in the app
Get step-by-step solutions on Sovi AI
Photo-based solutions with guided steps
Explore more problems and detailed explanations
The graph of the derivative is the fourth one (the parabola - shaped graph opening downward with vertex at \( x = 0 \), \( y = 4 \) and x - intercepts at \( x=-2 \) and \( x = 2 \)). (Assuming the fourth graph is the one with the peak at x=0, crossing x - axis at x=-2 and x=2, opening downward)