QUESTION IMAGE
Question
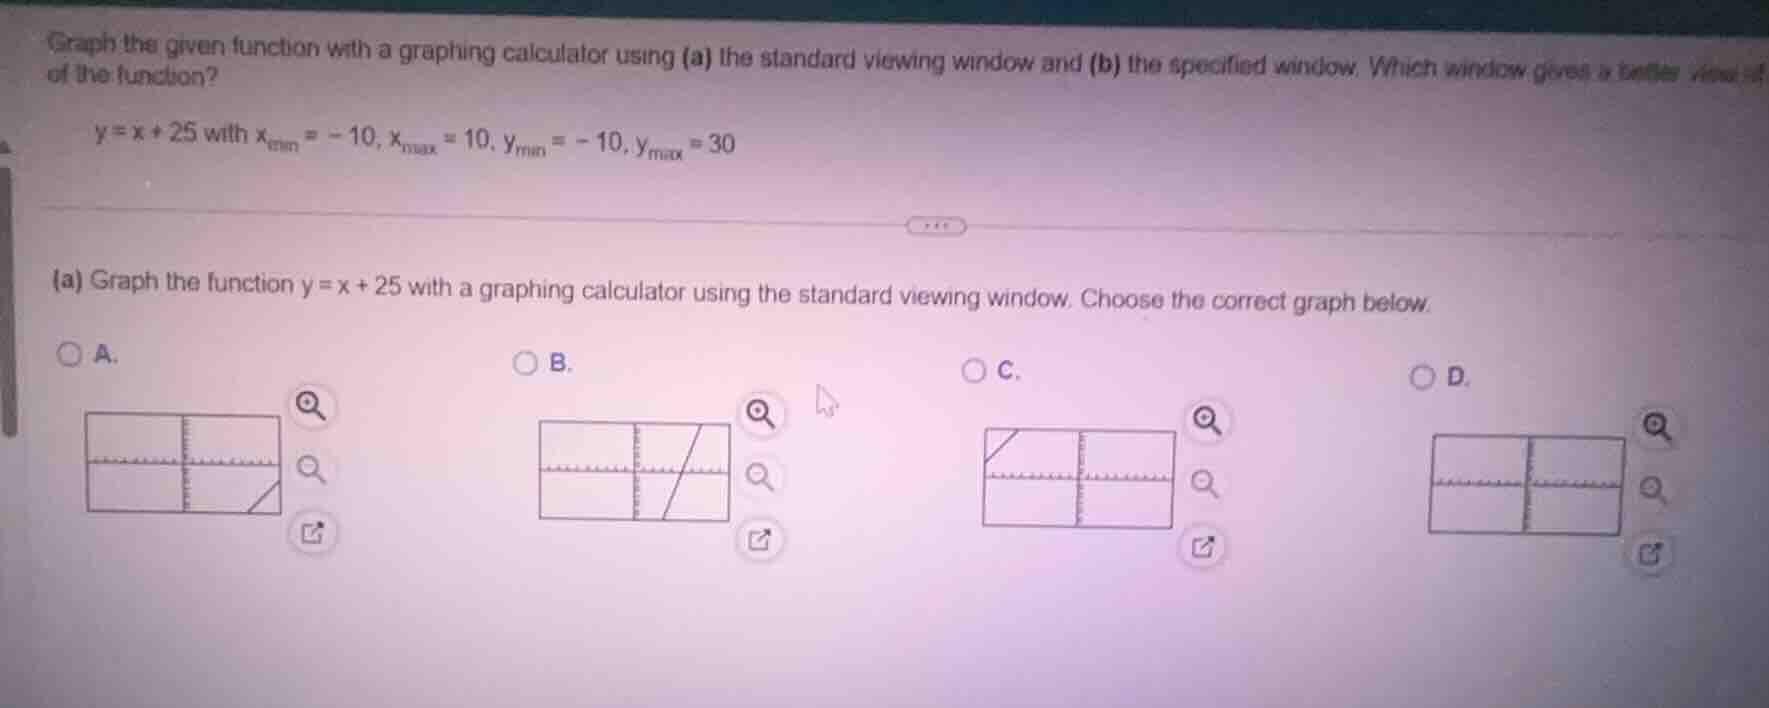
graph the given function with a graphing calculator using (a) the standard viewing window and (b) the specified window. which window gives a better view of the function?
y = x + 25 with ( x_{\text{min}} = -10 ), ( x_{\text{max}} = 10 ), ( y_{\text{min}} = -10 ), ( y_{\text{max}} = 30 )
(a) graph the function ( y = x + 25 ) with a graphing calculator using the standard viewing window. choose the correct graph below.
○ a.
○ b.
○ c.
○ d.
Step1: Analyze the function \( y = x + 25 \)
This is a linear function with a slope of \( 1 \) and a y - intercept of \( 25 \). The standard viewing window for most graphing calculators is usually \( x\in[-10,10] \) and \( y\in[-10,10] \) (or similar, but the key is that the y - intercept of \( 25 \) is far above the standard \( y \) - range of \( - 10\) to \(10\)).
Step2: Evaluate the standard window
In the standard viewing window, since the y - intercept is \( 25 \), the line \( y=x + 25 \) will be mostly outside the standard \( y \) - range (because the standard \( y \) - max is around \( 10 \) or similar, and \( 25>10 \)). So the graph in the standard window will show a small part of the line, likely near the bottom or not visible properly.
Step3: Analyze the given options
- Option A: Shows a line in the lower right, but our line has a positive slope and a high y - intercept, so this is incorrect.
- Option B: The line has a positive slope. Since \( y=x + 25 \), when \( x=- 10 \), \( y=-10 + 25=15 \); when \( x = 10 \), \( y=10 + 25 = 35 \). But the specified window for part (b) has \( y_{max}=30 \), but for the standard window analysis, we know that the standard window's \( y \) - range is too small. However, among the options, the line with positive slope (since the function has a slope of \( 1 \)) that is consistent with the linear function's nature (positive slope) and the fact that in the standard window, we would see a line that is "cut off" but has a positive slope. Wait, actually, let's recast: the function \( y=x + 25 \) has a slope of \( 1 \), so it's a line going up from left to right. In the standard window, since \( y \) - max is low, the line will be above the window. But looking at the options, option C shows a line in the upper left, which is consistent with a line with positive slope (going from upper left to lower right? No, wait, slope \( 1 \) is going from lower left to upper right. Wait, no, slope \( m = 1=\frac{\Delta y}{\Delta x}\), so as \( x \) increases, \( y \) increases. So when \( x \) is small (negative), \( y=x + 25 \) is \( 25+x \), so when \( x=-10 \), \( y = 15 \); when \( x = 10 \), \( y=35 \). In the standard window, the \( y \) - range is too small, so the line will be above the window. But among the options, option C has a line in the upper left (which would be when \( x \) is negative, \( y \) is still relatively large, but since the standard window's \( y \) - max is low, the line is cut off. Wait, maybe I made a mistake. Let's think again: the function \( y=x + 25 \) is a straight line with slope \( 1 \). The standard window has \( x\in[-10,10] \) and \( y\in[-10,10] \). For \( x=-10 \), \( y = 15 \) (which is above \( y = 10 \)), for \( x = 0 \), \( y=25 \) (way above), for \( x = 10 \), \( y = 35 \) (way above). So in the standard window, the line will enter the window from the left - top (since when \( x \) is negative, \( y=x + 25 \) is \( 25+x \), so when \( x=-10 \), \( y = 15 \), which is above \( y = 10 \), and as \( x \) increases, \( y \) increases, so the line will be a small segment in the upper part of the window, going from left (higher \( x \) - negative, \( y = 15 \)) to right (higher \( x \), but \( y \) is still above the window). Wait, the options: option C shows a line in the upper left, which is consistent with a line with positive slope (going from upper left to lower right? No, slope \( 1 \) is lower left to upper right. Wait, maybe the options are drawn with the window, and the correct graph for the standard window (where \( y \) is too small) would be optio…

Snap & solve any problem in the app
Get step-by-step solutions on Sovi AI
Photo-based solutions with guided steps
Explore more problems and detailed explanations
C