QUESTION IMAGE
Question
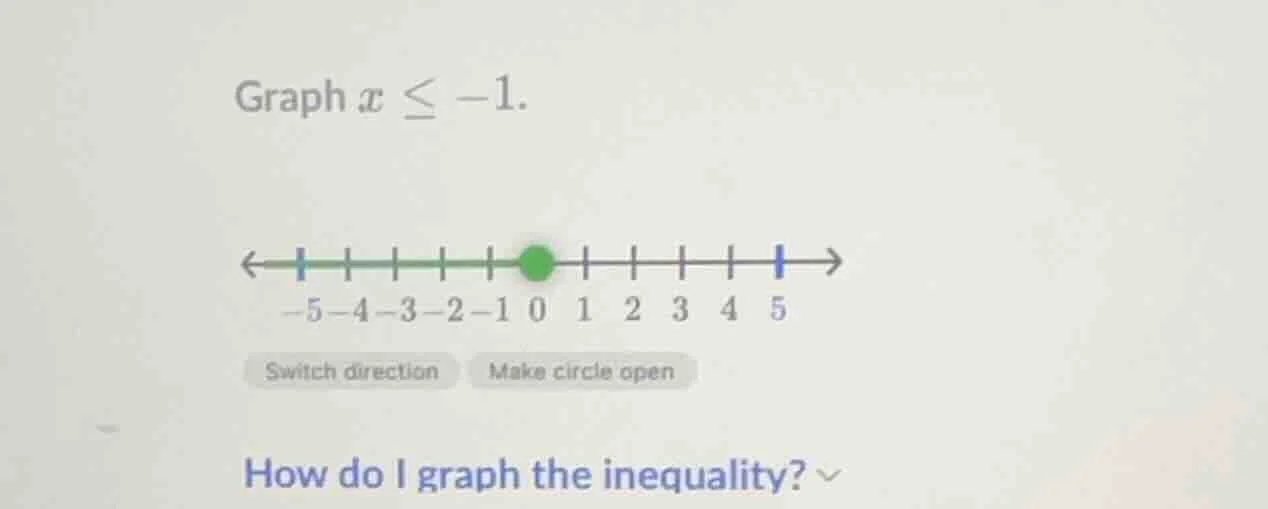
graph $x \leq -1$.
how do i graph the inequality?
Step1: Identify the critical point
The inequality is \( x \leq -1 \), so the critical point is \( x = -1 \).
Step2: Determine the circle type
Since the inequality is "less than or equal to", we use a closed (filled) circle at \( x = -1 \) to indicate that \( -1 \) is included in the solution set.
Step3: Determine the direction of the line
For \( x \leq -1 \), we shade (or draw the line) to the left of \( -1 \) because we want all values of \( x \) that are less than or equal to \( -1 \).

Snap & solve any problem in the app
Get step-by-step solutions on Sovi AI
Photo-based solutions with guided steps
Explore more problems and detailed explanations
- Draw a closed (filled) circle at \( x = -1 \) on the number line.
- Draw a line extending to the left from the closed circle to represent all values of \( x \) that satisfy \( x \leq -1 \).