QUESTION IMAGE
Question
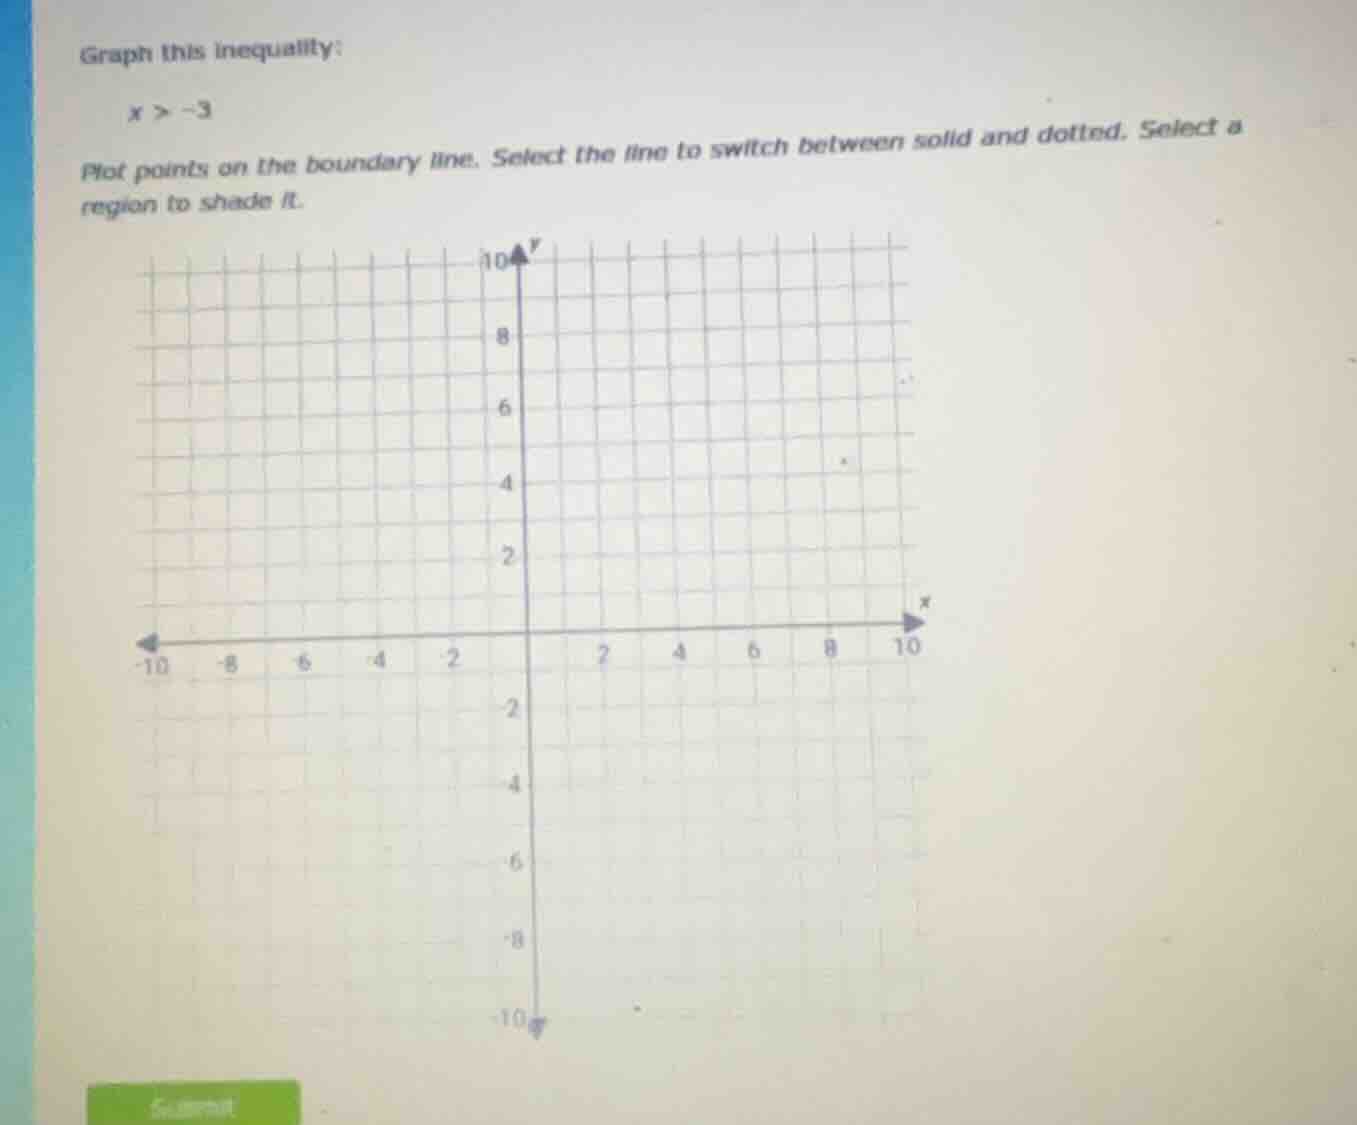
graph this inequality:
x > -3
plot points on the boundary line. select the line to switch between solid and dotted. select a region to shade it.
Step1: Determine boundary line type
The inequality is \( x > -3 \). Since the inequality is strict (\(>\) not \(\geq\)), the boundary line \( x = -3 \) is dashed (dotted) because the points on \( x = -3 \) are not included in the solution.
Step2: Identify the boundary line
The line \( x = -3 \) is a vertical line passing through \( x = -3 \) on the x - axis. So we plot a dashed vertical line at \( x=-3 \).
Step3: Determine the region to shade
For the inequality \( x > -3 \), we need to shade the region where the x - values are greater than - 3. This is the region to the right of the dashed line \( x=-3 \).
To graph \( x > - 3 \):
- Draw a dotted (dashed) vertical line at \( x=-3 \) (since \( x=-3 \) is not included in the solution set).
- Shade the region to the right of the line \( x = - 3 \) (this region contains all points where the x - coordinate is greater than - 3).
(Note: Since this is a graphing task, the final answer is the described graph with a dotted vertical line at \( x = - 3 \) and the region to the right of the line shaded.)

Snap & solve any problem in the app
Get step-by-step solutions on Sovi AI
Photo-based solutions with guided steps
Explore more problems and detailed explanations
Step1: Determine boundary line type
The inequality is \( x > -3 \). Since the inequality is strict (\(>\) not \(\geq\)), the boundary line \( x = -3 \) is dashed (dotted) because the points on \( x = -3 \) are not included in the solution.
Step2: Identify the boundary line
The line \( x = -3 \) is a vertical line passing through \( x = -3 \) on the x - axis. So we plot a dashed vertical line at \( x=-3 \).
Step3: Determine the region to shade
For the inequality \( x > -3 \), we need to shade the region where the x - values are greater than - 3. This is the region to the right of the dashed line \( x=-3 \).
To graph \( x > - 3 \):
- Draw a dotted (dashed) vertical line at \( x=-3 \) (since \( x=-3 \) is not included in the solution set).
- Shade the region to the right of the line \( x = - 3 \) (this region contains all points where the x - coordinate is greater than - 3).
(Note: Since this is a graphing task, the final answer is the described graph with a dotted vertical line at \( x = - 3 \) and the region to the right of the line shaded.)