QUESTION IMAGE
Question
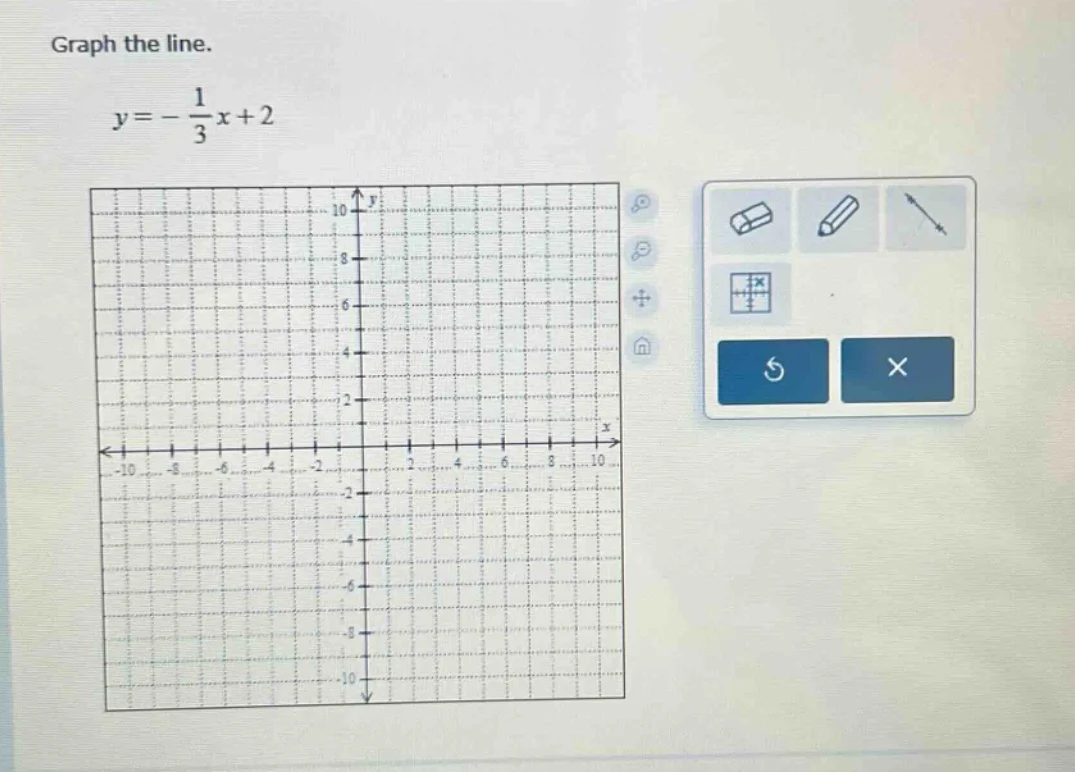
graph the line.
$y = -\frac{1}{3}x + 2$
Step1: Identify the y - intercept
The equation of the line is in slope - intercept form \(y = mx + b\), where \(b\) is the y - intercept. For the equation \(y=-\frac{1}{3}x + 2\), when \(x = 0\), \(y=2\). So the y - intercept is the point \((0,2)\). We plot this point on the coordinate plane.
Step2: Identify the slope
The slope \(m=-\frac{1}{3}\). The slope is defined as \(\frac{\text{rise}}{\text{run}}\). A slope of \(-\frac{1}{3}\) means that for every 3 units we move to the right (run = 3) along the x - axis, we move down 1 unit (rise=- 1) along the y - axis. Starting from the point \((0,2)\), if we move 3 units to the right (to \(x = 3\)) and 1 unit down (to \(y=2 - 1=1\)), we get the point \((3,1)\). We can also move in the opposite direction: for a run of \(- 3\) (3 units to the left) and a rise of \(1\) (1 unit up), starting from \((0,2)\), we move to \(x=0 - 3=-3\) and \(y = 2+1 = 3\), getting the point \((-3,3)\).
Step3: Draw the line
After plotting two or more points (e.g., \((0,2)\), \((3,1)\), \((-3,3)\)), we draw a straight line passing through these points.
(Note: Since this is a graphing problem, the final answer is the graph of the line \(y =-\frac{1}{3}x + 2\) with the y - intercept at \((0,2)\) and a slope of \(-\frac{1}{3}\), passing through points like \((3,1)\) and \((-3,3)\) etc.)

Snap & solve any problem in the app
Get step-by-step solutions on Sovi AI
Photo-based solutions with guided steps
Explore more problems and detailed explanations
Step1: Identify the y - intercept
The equation of the line is in slope - intercept form \(y = mx + b\), where \(b\) is the y - intercept. For the equation \(y=-\frac{1}{3}x + 2\), when \(x = 0\), \(y=2\). So the y - intercept is the point \((0,2)\). We plot this point on the coordinate plane.
Step2: Identify the slope
The slope \(m=-\frac{1}{3}\). The slope is defined as \(\frac{\text{rise}}{\text{run}}\). A slope of \(-\frac{1}{3}\) means that for every 3 units we move to the right (run = 3) along the x - axis, we move down 1 unit (rise=- 1) along the y - axis. Starting from the point \((0,2)\), if we move 3 units to the right (to \(x = 3\)) and 1 unit down (to \(y=2 - 1=1\)), we get the point \((3,1)\). We can also move in the opposite direction: for a run of \(- 3\) (3 units to the left) and a rise of \(1\) (1 unit up), starting from \((0,2)\), we move to \(x=0 - 3=-3\) and \(y = 2+1 = 3\), getting the point \((-3,3)\).
Step3: Draw the line
After plotting two or more points (e.g., \((0,2)\), \((3,1)\), \((-3,3)\)), we draw a straight line passing through these points.
(Note: Since this is a graphing problem, the final answer is the graph of the line \(y =-\frac{1}{3}x + 2\) with the y - intercept at \((0,2)\) and a slope of \(-\frac{1}{3}\), passing through points like \((3,1)\) and \((-3,3)\) etc.)