QUESTION IMAGE
Question
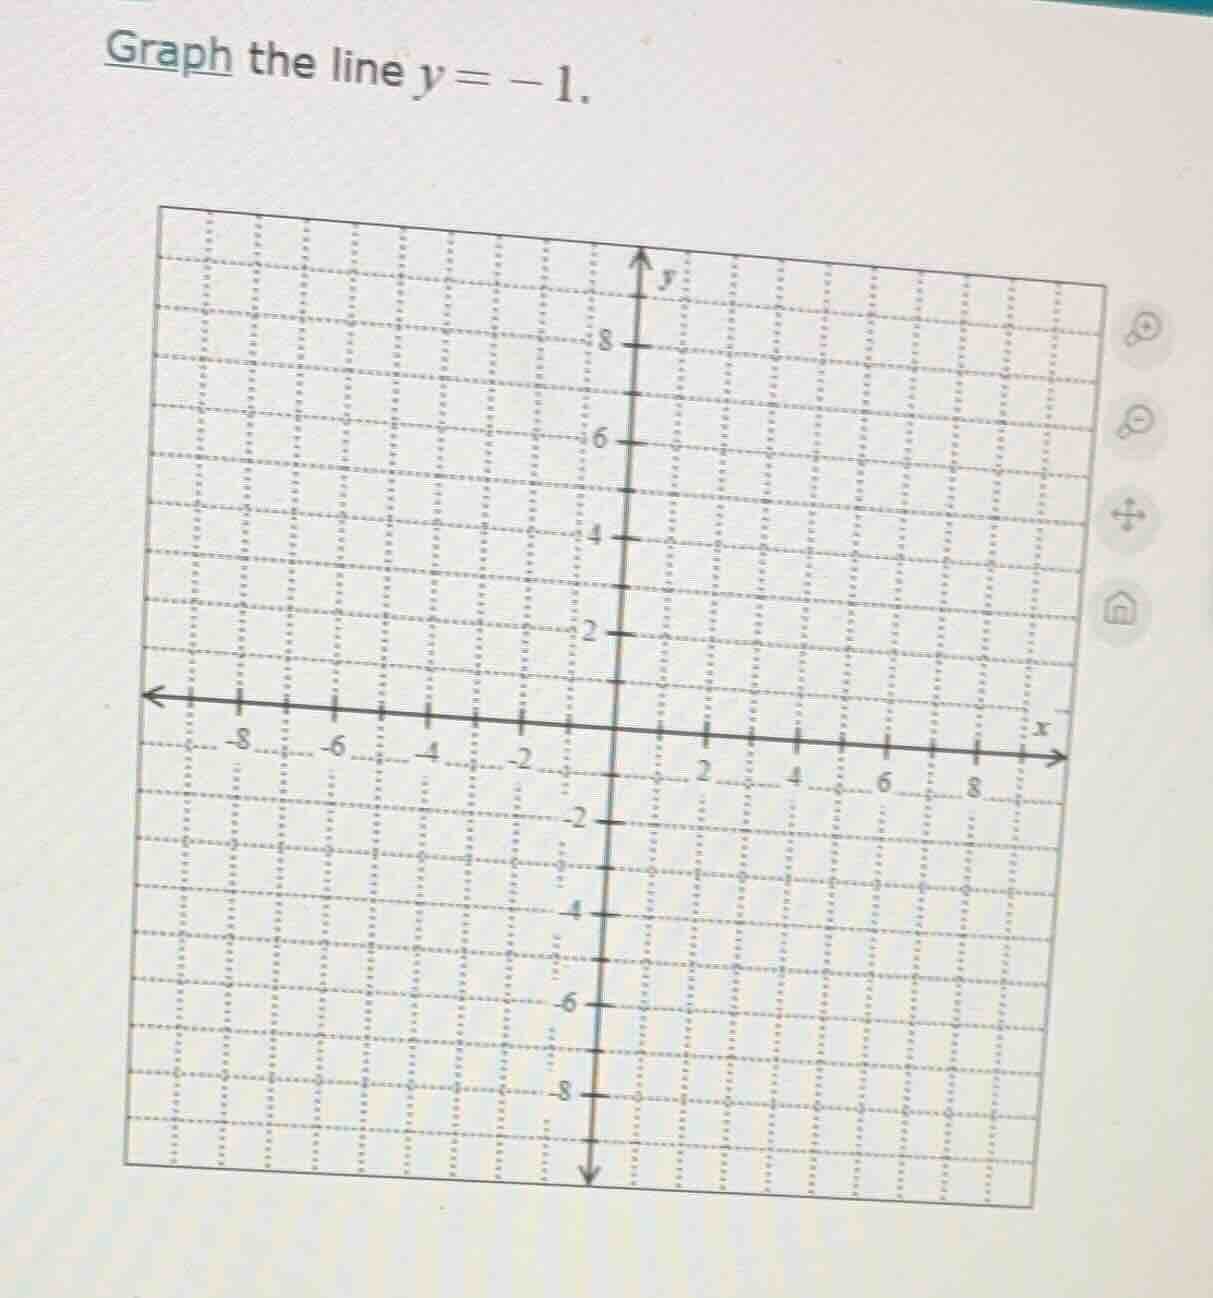
graph the line $y = -1$.
Step1: Understand the equation
The equation \( y = -1 \) represents a horizontal line. For any value of \( x \), the \( y \)-coordinate is always \(-1\). So, we need to find the line where all points have \( y = -1 \).
Step2: Locate \( y = -1 \) on the y-axis
On the given coordinate grid, the y-axis has markings. We find the position where \( y = -1 \). Looking at the grid, the horizontal line passing through \( y = -1 \) (between \( y = -2 \) and \( y = 0 \), at the midpoint? Wait, no, the grid lines: let's see, the y-axis has ticks. Let's check the vertical axis. The line \( y = -1 \) is a horizontal line. So we draw a horizontal line that passes through all points with \( y \)-coordinate equal to \(-1\). So on the grid, we identify the \( y = -1 \) level (since the grid has lines, we can see that between \( y = -2 \) and \( y = 0 \), but actually, let's check the spacing. The y-axis has ticks at 8,6,4,2,0,-2,-4,-6,-8. Wait, maybe the grid lines are at integer values? Wait, the problem is to graph \( y = -1 \). So we draw a horizontal line (since the equation is \( y = \text{constant} \)) that passes through \( y = -1 \). So on the coordinate plane, this line will be parallel to the x-axis, crossing the y-axis at \( (0, -1) \) and extending infinitely in both directions (left and right) along the line where \( y = -1 \).

Snap & solve any problem in the app
Get step-by-step solutions on Sovi AI
Photo-based solutions with guided steps
Explore more problems and detailed explanations
To graph \( y = -1 \), draw a horizontal line parallel to the \( x \)-axis that passes through the point \( (0, -1) \) (and all other points with \( y \)-coordinate \(-1\)) on the coordinate grid.