QUESTION IMAGE
Question
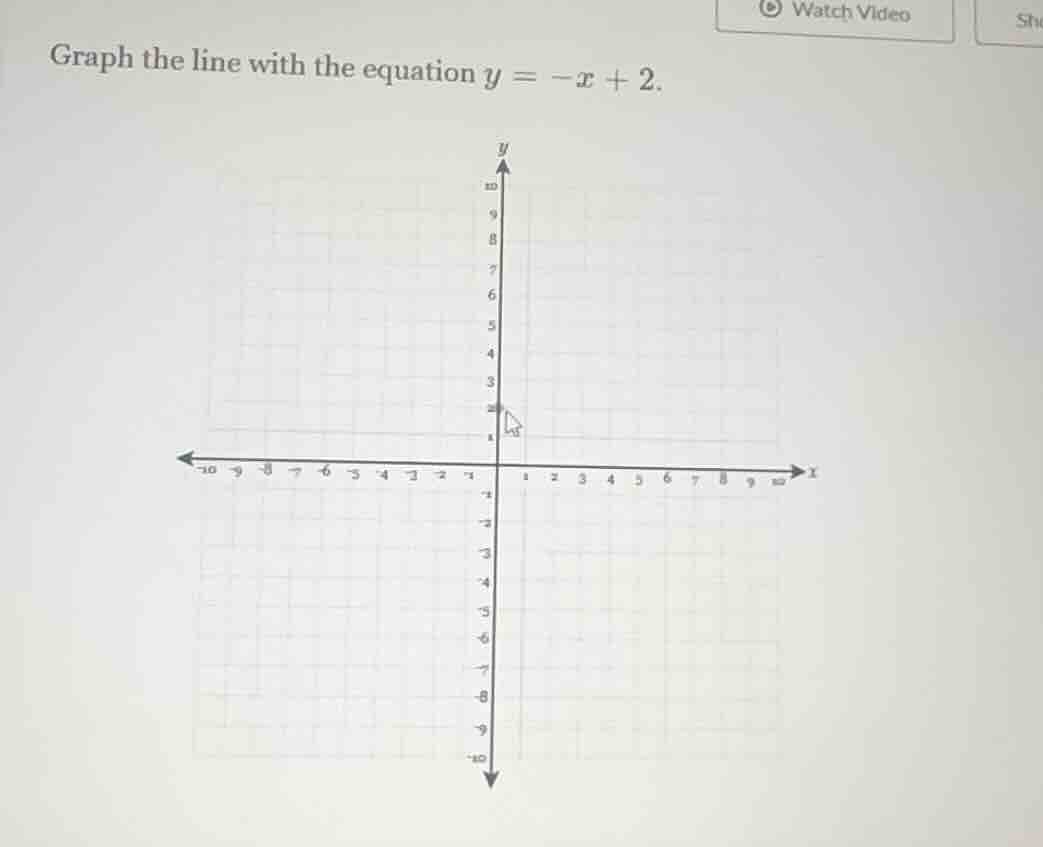
graph the line with the equation $y = -x + 2$.
Step1: Identify the slope and y - intercept
The equation of the line is in the slope - intercept form \(y=mx + b\), where \(m\) is the slope and \(b\) is the y - intercept. For the equation \(y=-x + 2\), the slope \(m=- 1\) and the y - intercept \(b = 2\). This means the line crosses the y - axis at the point \((0,2)\).
Step2: Plot the y - intercept
On the coordinate plane, find the point \((0,2)\) (since when \(x = 0\), \(y=2\)) and mark it.
Step3: Use the slope to find another point
The slope \(m=-1=\frac{- 1}{1}=\frac{\text{rise}}{\text{run}}\). From the y - intercept \((0,2)\), we can go down 1 unit (because the rise is - 1) and then right 1 unit (because the run is 1). So we move from \((0,2)\) to \((0 + 1,2-1)=(1,1)\). We can also go up 1 unit and left 1 unit (since \(\frac{1}{-1}\) is also equal to - 1) to get the point \((-1,3)\).
Step4: Draw the line
Connect the points (such as \((0,2)\), \((1,1)\), \((-1,3)\)) with a straight line. This line represents the equation \(y=-x + 2\).
(Note: Since the problem is about graphing, the final answer is the graph of the line \(y=-x + 2\) passing through points like \((0,2)\), \((1,1)\), \((-1,3)\) etc. If we were to describe the key points for plotting: the y - intercept is at \((0,2)\) and using the slope of - 1, we can find other points to draw the line.)

Snap & solve any problem in the app
Get step-by-step solutions on Sovi AI
Photo-based solutions with guided steps
Explore more problems and detailed explanations
Step1: Identify the slope and y - intercept
The equation of the line is in the slope - intercept form \(y=mx + b\), where \(m\) is the slope and \(b\) is the y - intercept. For the equation \(y=-x + 2\), the slope \(m=- 1\) and the y - intercept \(b = 2\). This means the line crosses the y - axis at the point \((0,2)\).
Step2: Plot the y - intercept
On the coordinate plane, find the point \((0,2)\) (since when \(x = 0\), \(y=2\)) and mark it.
Step3: Use the slope to find another point
The slope \(m=-1=\frac{- 1}{1}=\frac{\text{rise}}{\text{run}}\). From the y - intercept \((0,2)\), we can go down 1 unit (because the rise is - 1) and then right 1 unit (because the run is 1). So we move from \((0,2)\) to \((0 + 1,2-1)=(1,1)\). We can also go up 1 unit and left 1 unit (since \(\frac{1}{-1}\) is also equal to - 1) to get the point \((-1,3)\).
Step4: Draw the line
Connect the points (such as \((0,2)\), \((1,1)\), \((-1,3)\)) with a straight line. This line represents the equation \(y=-x + 2\).
(Note: Since the problem is about graphing, the final answer is the graph of the line \(y=-x + 2\) passing through points like \((0,2)\), \((1,1)\), \((-1,3)\) etc. If we were to describe the key points for plotting: the y - intercept is at \((0,2)\) and using the slope of - 1, we can find other points to draw the line.)