QUESTION IMAGE
Question
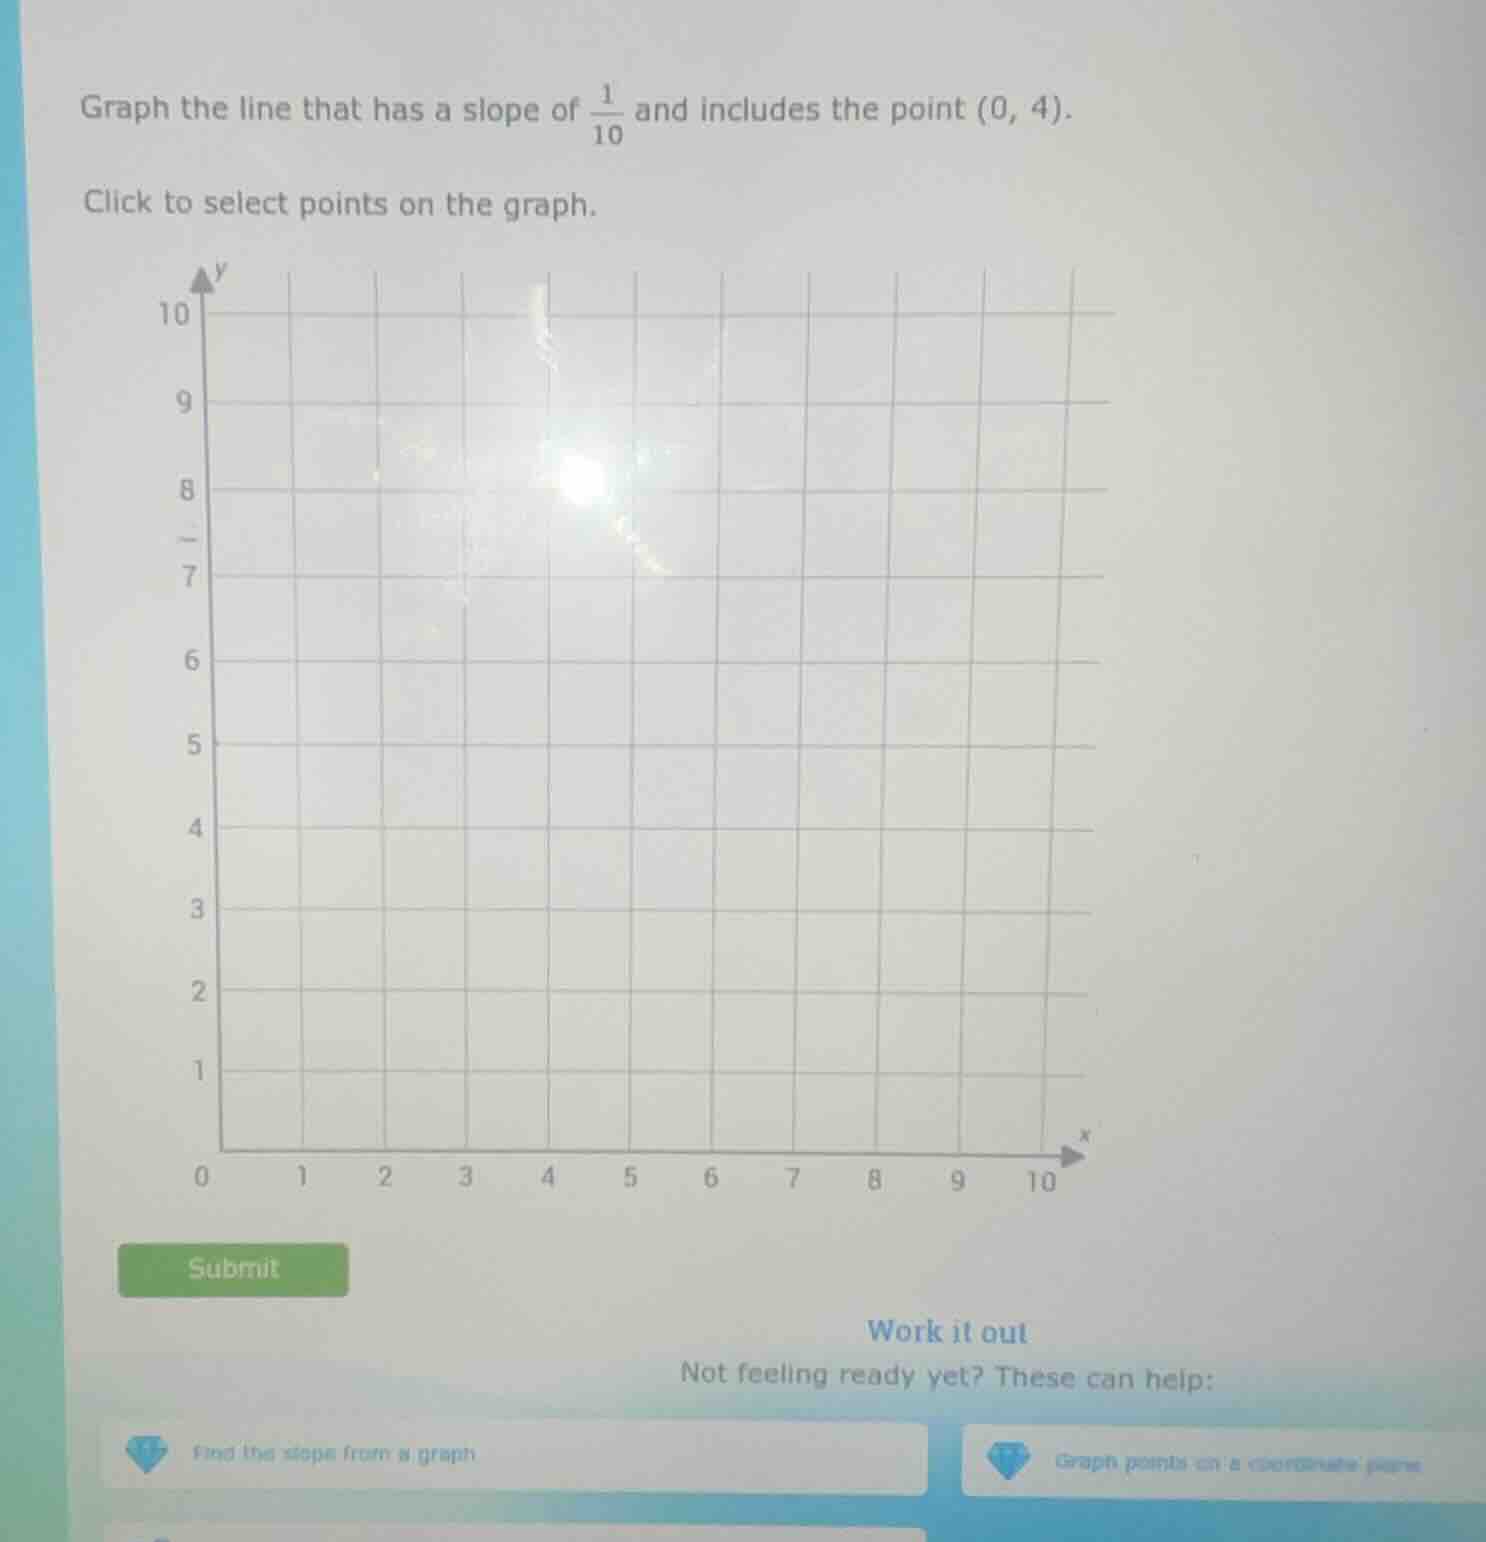
graph the line that has a slope of \\(\frac{1}{10}\\) and includes the point \\((0, 4)\\). click to select points on the graph.
Step1: Recall the slope-intercept form
The slope - intercept form of a line is $y = mx + b$, where $m$ is the slope and $b$ is the y - intercept. We know that the slope $m=\frac{1}{10}$ and the line passes through the point $(0,4)$. When $x = 0$, $y=b$, so the y - intercept $b = 4$. So the equation of the line is $y=\frac{1}{10}x + 4$.
Step2: Identify the starting point
The point $(0,4)$ is on the line (since when $x = 0$, $y=4$). So we first plot the point $(0,4)$ on the graph.
Step3: Use the slope to find another point
The slope $m=\frac{1}{10}$ means that for a run (change in $x$) of $10$, the rise (change in $y$) is $1$. So if we start at the point $(0,4)$ and move $10$ units to the right (increase $x$ by $10$) to $x = 10$, and then move $1$ unit up (increase $y$ by $1$) from $y = 4$ to $y=5$, we get the point $(10,5)$. We can also use smaller changes. For example, for a run of $1$ (change in $x$ by $1$), the rise is $\frac{1}{10}$. But since the grid has integer coordinates, using a run of $10$ is more convenient for plotting.
To graph the line, we plot the points $(0,4)$ and $(10,5)$ (or other points obtained by using the slope) and draw a straight line through them.

Snap & solve any problem in the app
Get step-by-step solutions on Sovi AI
Photo-based solutions with guided steps
Explore more problems and detailed explanations
To graph the line:
- Plot the point \((0, 4)\) (since the line passes through this point as it is the y - intercept).
- Use the slope \(\frac{1}{10}\): from the point \((0, 4)\), move 10 units to the right (along the x - axis) to \(x = 10\) and 1 unit up (along the y - axis) to \(y=5\), then plot the point \((10, 5)\).
- Draw a straight line through the points \((0, 4)\) and \((10, 5)\) (and other points that satisfy \(y=\frac{1}{10}x + 4\)).