QUESTION IMAGE
Question
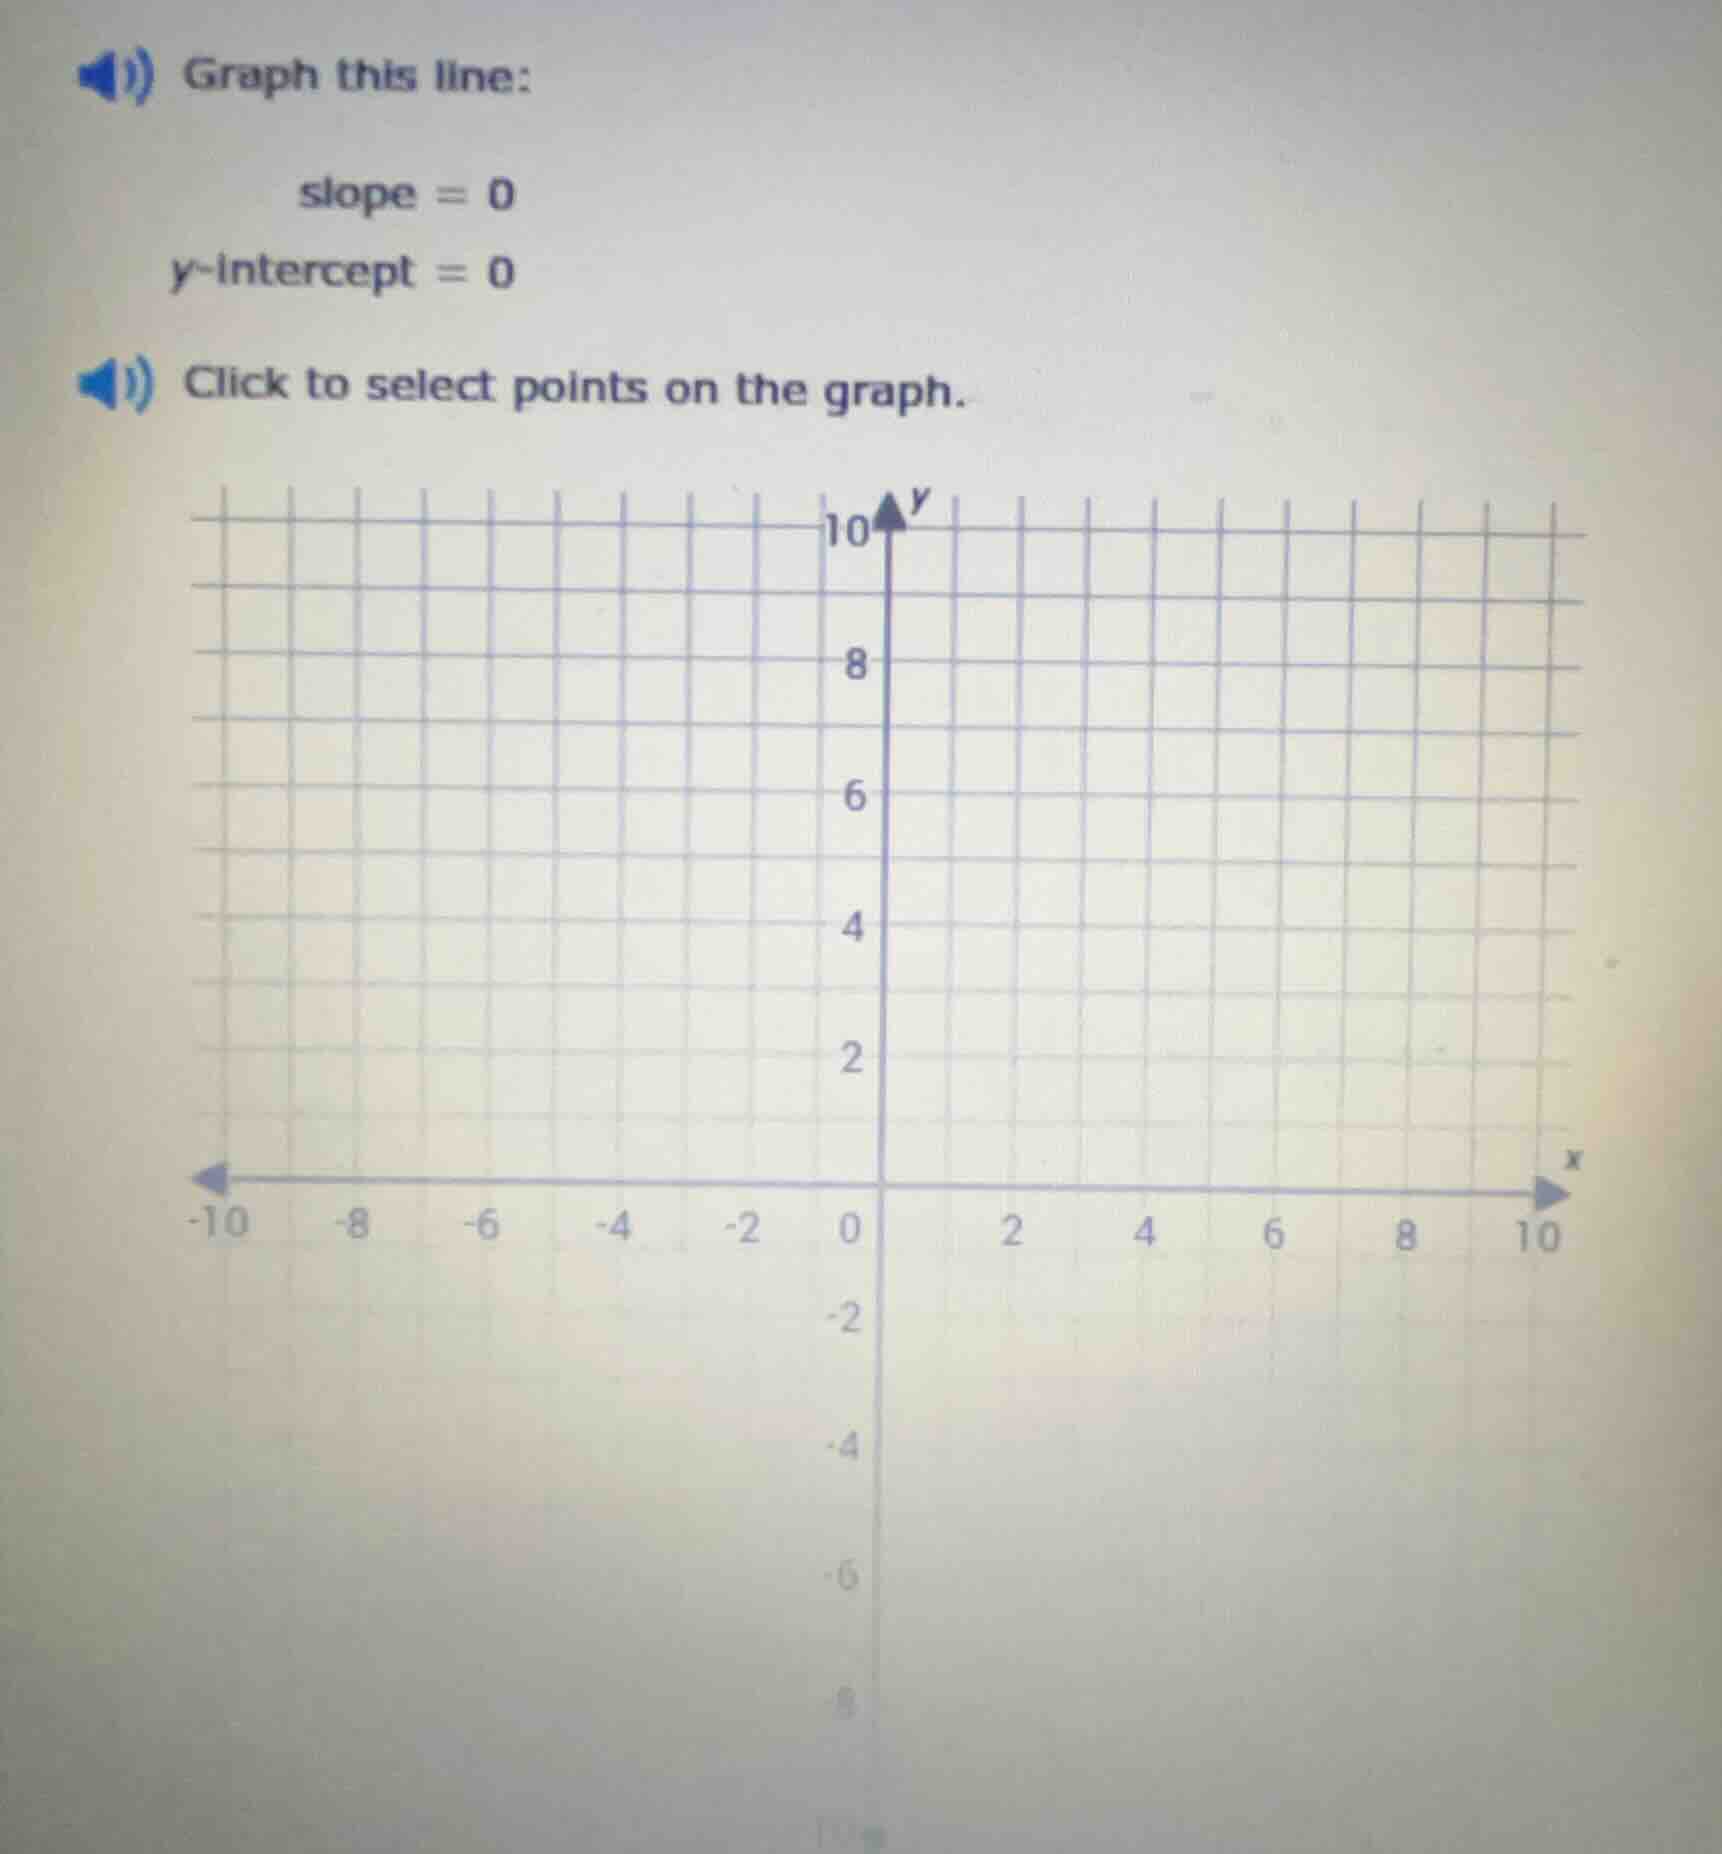
graph this line: slope = 0 y-intercept = 0 click to select points on the graph.
Step1: Recall slope - intercept form
The slope - intercept form of a line is $y = mx + b$, where $m$ is the slope and $b$ is the $y$-intercept.
Given that $m = 0$ and $b = 0$, we substitute these values into the equation: $y=0\times x + 0$, which simplifies to $y = 0$.
Step2: Analyze the line $y = 0$
The line $y = 0$ is the $x$-axis. For any value of $x$, the value of $y$ is $0$. So some points on this line are $(0,0)$, $(1,0)$, $(- 1,0)$, $(2,0)$, $(-2,0)$ etc. To graph this line, we can plot the points where $y = 0$ and draw a horizontal line through them.

Snap & solve any problem in the app
Get step-by-step solutions on Sovi AI
Photo-based solutions with guided steps
Explore more problems and detailed explanations
The line $y = 0$ (the $x$-axis) is graphed by plotting points with $y$-coordinate $0$ (e.g., $(0,0)$, $(1,0)$, $(-1,0)$) and drawing a horizontal line through them.