QUESTION IMAGE
Question
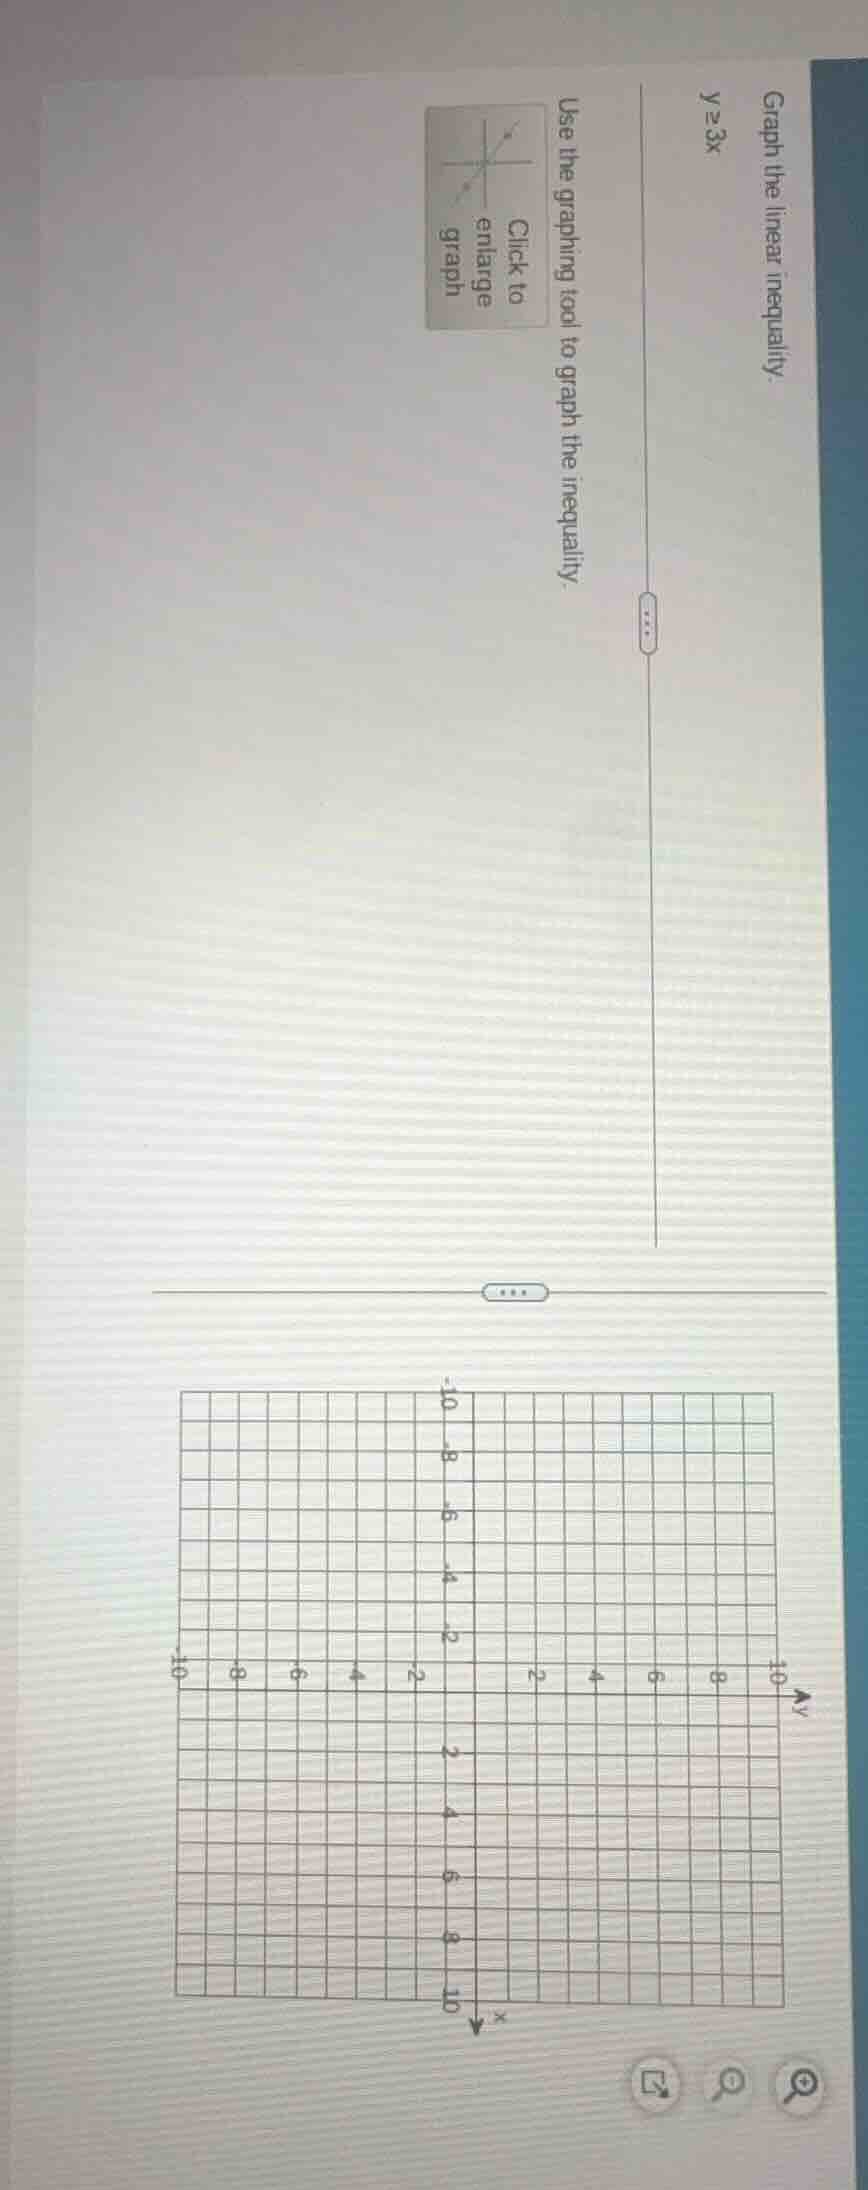
graph the linear inequality. $y \geq 3x$
use the graphing tool to graph the inequality.
click to enlarge graph
Step1: Graph the boundary line
First, identify the boundary line $y=3x$. This is a straight line with slope $3$ and y-intercept $0$. Since the inequality is $\geq$, we use a solid line (not dashed) to include points on the line.
Step2: Test a point for shading
Choose a test point not on the line, e.g., $(0,1)$. Substitute into the inequality: $1 \geq 3(0) \implies 1 \geq 0$, which is true. So we shade the region that contains $(0,1)$ (the area above the line $y=3x$).

Snap & solve any problem in the app
Get step-by-step solutions on Sovi AI
Photo-based solutions with guided steps
Explore more problems and detailed explanations
- Draw a solid straight line representing $y=3x$ (passing through $(0,0)$ and $(1,3)$).
- Shade the entire region above this solid line.