QUESTION IMAGE
Question
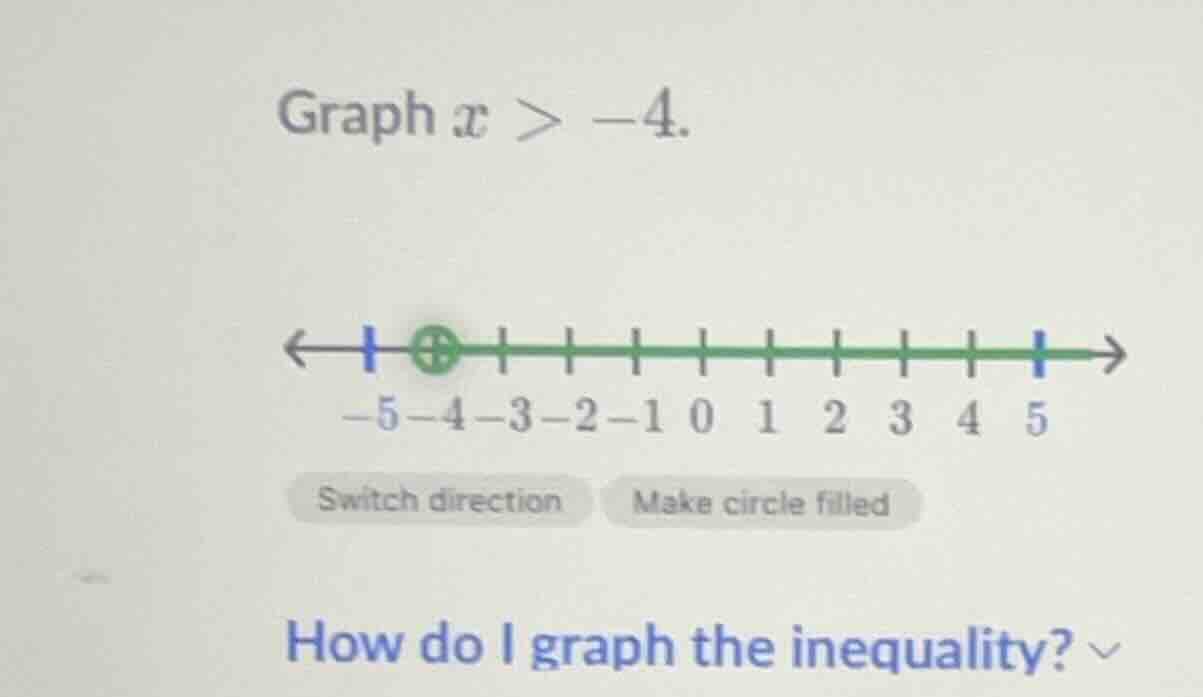
graph $x > -4$.
(number line from -5 to 5 with -4 marked by an open circle and a green line to the right, along with buttons switch direction and make circle filled)
how do i graph the inequality?
Step1: Identify the critical point
The inequality is \( x > -4 \), so the critical value is \( -4 \). We mark this point on the number line.
Step2: Determine the circle type
Since the inequality is \( > \) (not \( \geq \)), we use an open (unfilled) circle at \( -4 \) to show that \( -4 \) is not included in the solution set.
Step3: Determine the direction of the line
For \( x > -4 \), the solutions are all numbers greater than \( -4 \), so we draw an arrow starting from the open circle at \( -4 \) and pointing to the right (towards positive infinity) on the number line.

Snap & solve any problem in the app
Get step-by-step solutions on Sovi AI
Photo-based solutions with guided steps
Explore more problems and detailed explanations
To graph \( x > -4 \):
- Locate \( -4 \) on the number line.
- Draw an open (unfilled) circle at \( -4 \) (because \( -4 \) is not a solution, as the inequality is \( > \), not \( \geq \)).
- Draw a line with an arrow starting from the open circle at \( -4 \) and extending to the right (towards values greater than \( -4 \)) to represent all numbers greater than \( -4 \).