QUESTION IMAGE
Question
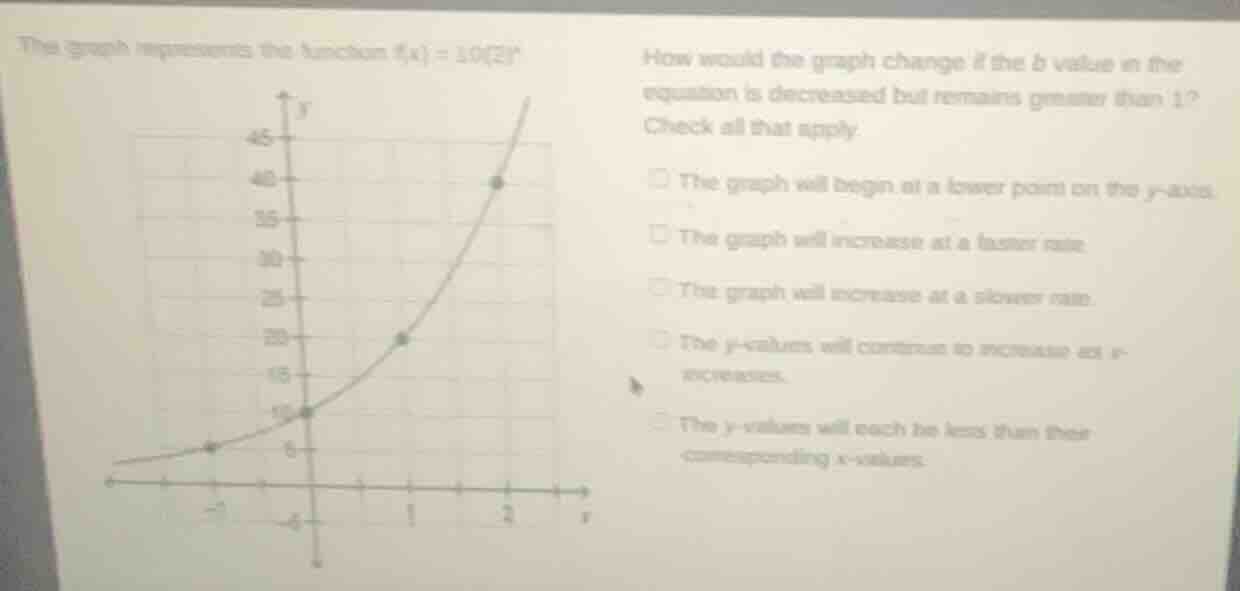
the graph represents the function $f(x) = 10(2)^x$
how would the graph change if the $b$ value in the equation is decreased but remains greater than 1?
check all that apply.
$square$ the graph will begin at a lower point on the $y$-axis.
$square$ the graph will increase at a faster rate.
$square$ the graph will increase at a slower rate.
$square$ the $y$-values will continue to increase as $x$-increases.
$square$ the $y$-values will each be less than their corresponding $x$-values.
The given function is an exponential growth function of the form $f(x)=a(b)^x$, where $a=10$ (the y-intercept, since $f(0)=10$) and $b=2$ (the growth factor, $b>1$ for growth).
- The y-intercept is determined by $a$, not $b$, so changing $b$ (while $a$ stays 10) does not change the starting point on the y-axis.
- When $b$ is decreased but remains greater than 1, the function still represents exponential growth, but the growth rate is slower than when $b$ was larger.
- Since $b>1$, as $x$ increases, $y$-values will still continue to increase (it remains a growth function, not decay).
- The claim that $y$-values will be less than corresponding $x$-values is false; for example, at $x=1$, the original function gives $y=20$, and even with a smaller $b$ like 1.5, $y=15$, which is still greater than $x=1$.

Snap & solve any problem in the app
Get step-by-step solutions on Sovi AI
Photo-based solutions with guided steps
Explore more problems and detailed explanations
The graph will increase at a slower rate.
The y-values will continue to increase as x increases.