QUESTION IMAGE
Question
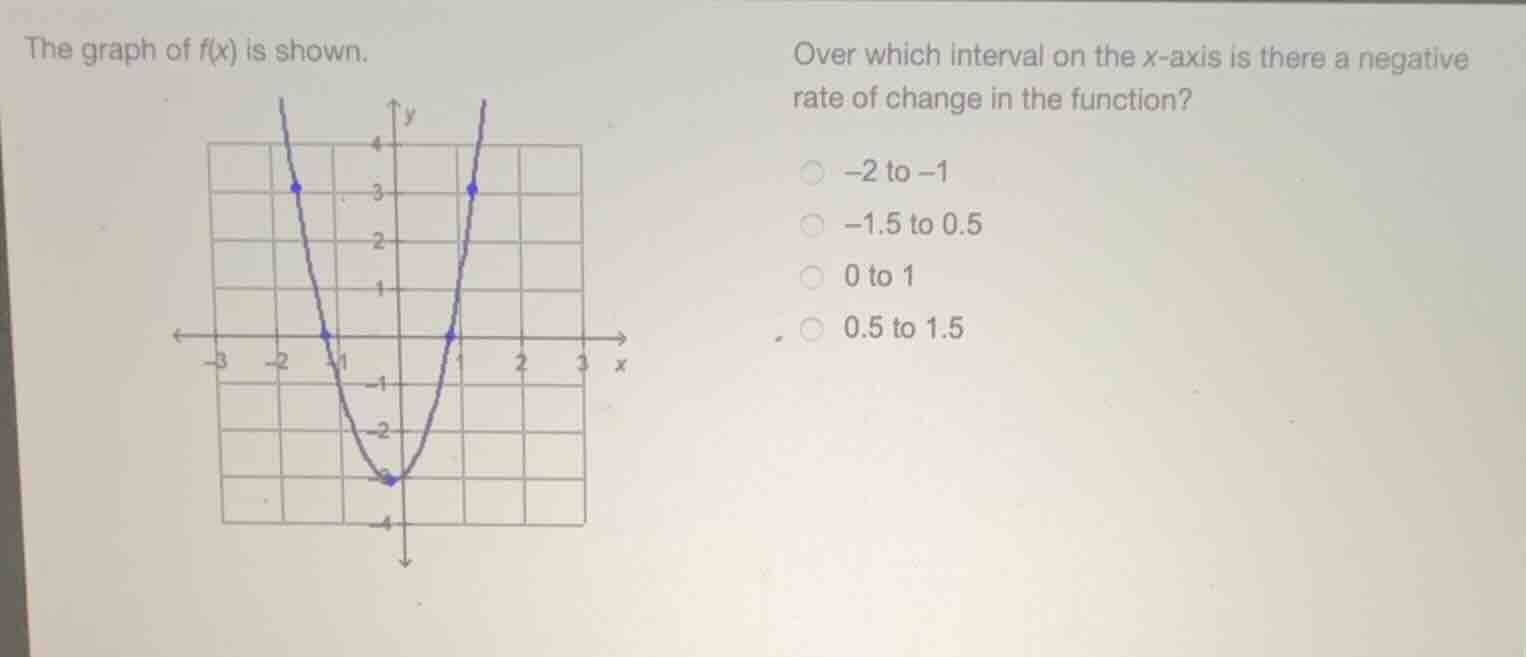
the graph of f(x) is shown.
over which interval on the x - axis is there a negative rate of change in the function?
-2 to -1
-1.5 to 0.5
0 to 1
0.5 to 1.5
Step1: Understand rate of change
A negative rate of change means the function is decreasing (as \( x \) increases, \( f(x) \) decreases). For a parabola (quadratic function) opening upwards, it decreases from \( -\infty \) to the vertex and increases from the vertex to \( +\infty \). The vertex here is at \( x = 0 \) (since the parabola is symmetric about the y - axis).
Step2: Analyze each interval
- Interval - 2 to - 1: As \( x \) increases from - 2 to - 1, we move from left to right towards the vertex. Since the vertex is at \( x = 0 \), and the parabola opens upwards, the function is decreasing in the interval from \( -\infty \) to \( 0 \). But let's check the values. At \( x=-2 \), \( f(-2) = 3 \); at \( x = - 1 \), \( f(-1)=0 \). Since \( 3>0 \), as \( x \) increases from - 2 to - 1, \( f(x) \) decreases? Wait, no, wait. Wait, the vertex is at \( (0, - 3) \). Wait, let's re - examine the graph. The parabola has a minimum at \( (0,-3) \). So when \( x \) is less than 0, as \( x \) increases towards 0, the function is decreasing? Wait, no. Wait, for a parabola \( y = ax^{2}+bx + c \) with \( a>0 \), the function is decreasing when \( x<-\frac{b}{2a} \) and increasing when \( x>-\frac{b}{2a} \). Here, the parabola is symmetric about the y - axis, so \( b = 0 \), and the axis of symmetry is \( x = 0 \). So for \( x<0 \), as \( x \) increases (moves towards 0), the function is decreasing? Wait, no. Wait, if \( x=-2 \), \( y = 3 \); \( x=-1 \), \( y = 0 \); \( x = 0 \), \( y=-3 \); \( x = 1 \), \( y = 0 \); \( x = 2 \), \( y = 3 \). So when \( x \) goes from - 2 to - 1 (increasing \( x \)), \( y \) goes from 3 to 0 (decreasing \( y \))? But wait, the vertex is at \( (0,-3) \), the lowest point. So when \( x \) is less than 0, as \( x \) increases towards 0, the function is decreasing? Wait, no, actually, when \( x \) is less than 0, as \( x \) increases (moves towards 0), the function is decreasing (since we are moving towards the minimum). But let's check the other intervals.
- Interval - 1.5 to 0.5: \( x \) goes from - 1.5 to 0.5. The left end \( x=-1.5 \) is less than 0, and the right end \( x = 0.5 \) is greater than 0. The function decreases from \( x=-1.5 \) to \( x = 0 \) (towards the vertex) and then increases from \( x = 0 \) to \( x=0.5 \). So overall, in this interval, the function first decreases then increases, so the rate of change is not negative throughout.
- Interval 0 to 1: \( x \) increases from 0 to 1. Since \( x>0 \) (to the right of the vertex), the function is increasing (as \( x \) increases, \( y \) increases from - 3 to 0). So the rate of change is positive.
- Interval 0.5 to 1.5: \( x \) increases from 0.5 to 1.5. Since \( x>0 \), the function is increasing (as \( x \) increases from 0.5 to 1.5, \( y \) increases from some value (at \( x = 0.5 \), \( y\) is between - 3 and 0) to \( y = 0 \) at \( x = 1 \) and then to \( y = 3 \) at \( x = 2 \)). So the rate of change is positive.
Wait, but wait, let's re - evaluate the first interval. Wait, the question is about negative rate of change (function is decreasing). The function is decreasing when \( x \) is in the interval where as \( x \) increases, \( f(x) \) decreases. The vertex is at \( x = 0 \). So for \( x<0 \), as \( x \) increases (moves towards 0), \( f(x) \) decreases. But let's check the interval - 1.5 to 0.5. In this interval, when \( x \) goes from - 1.5 to 0, \( f(x) \) decreases (since we are moving towards the minimum), and when \( x \) goes from 0 to 0.5, \( f(x) \) increases. So the function is not decreasing throughout…

Snap & solve any problem in the app
Get step-by-step solutions on Sovi AI
Photo-based solutions with guided steps
Explore more problems and detailed explanations
Step1: Understand rate of change
A negative rate of change means the function is decreasing (as \( x \) increases, \( f(x) \) decreases). For a parabola (quadratic function) opening upwards, it decreases from \( -\infty \) to the vertex and increases from the vertex to \( +\infty \). The vertex here is at \( x = 0 \) (since the parabola is symmetric about the y - axis).
Step2: Analyze each interval
- Interval - 2 to - 1: As \( x \) increases from - 2 to - 1, we move from left to right towards the vertex. Since the vertex is at \( x = 0 \), and the parabola opens upwards, the function is decreasing in the interval from \( -\infty \) to \( 0 \). But let's check the values. At \( x=-2 \), \( f(-2) = 3 \); at \( x = - 1 \), \( f(-1)=0 \). Since \( 3>0 \), as \( x \) increases from - 2 to - 1, \( f(x) \) decreases? Wait, no, wait. Wait, the vertex is at \( (0, - 3) \). Wait, let's re - examine the graph. The parabola has a minimum at \( (0,-3) \). So when \( x \) is less than 0, as \( x \) increases towards 0, the function is decreasing? Wait, no. Wait, for a parabola \( y = ax^{2}+bx + c \) with \( a>0 \), the function is decreasing when \( x<-\frac{b}{2a} \) and increasing when \( x>-\frac{b}{2a} \). Here, the parabola is symmetric about the y - axis, so \( b = 0 \), and the axis of symmetry is \( x = 0 \). So for \( x<0 \), as \( x \) increases (moves towards 0), the function is decreasing? Wait, no. Wait, if \( x=-2 \), \( y = 3 \); \( x=-1 \), \( y = 0 \); \( x = 0 \), \( y=-3 \); \( x = 1 \), \( y = 0 \); \( x = 2 \), \( y = 3 \). So when \( x \) goes from - 2 to - 1 (increasing \( x \)), \( y \) goes from 3 to 0 (decreasing \( y \))? But wait, the vertex is at \( (0,-3) \), the lowest point. So when \( x \) is less than 0, as \( x \) increases towards 0, the function is decreasing? Wait, no, actually, when \( x \) is less than 0, as \( x \) increases (moves towards 0), the function is decreasing (since we are moving towards the minimum). But let's check the other intervals.
- Interval - 1.5 to 0.5: \( x \) goes from - 1.5 to 0.5. The left end \( x=-1.5 \) is less than 0, and the right end \( x = 0.5 \) is greater than 0. The function decreases from \( x=-1.5 \) to \( x = 0 \) (towards the vertex) and then increases from \( x = 0 \) to \( x=0.5 \). So overall, in this interval, the function first decreases then increases, so the rate of change is not negative throughout.
- Interval 0 to 1: \( x \) increases from 0 to 1. Since \( x>0 \) (to the right of the vertex), the function is increasing (as \( x \) increases, \( y \) increases from - 3 to 0). So the rate of change is positive.
- Interval 0.5 to 1.5: \( x \) increases from 0.5 to 1.5. Since \( x>0 \), the function is increasing (as \( x \) increases from 0.5 to 1.5, \( y \) increases from some value (at \( x = 0.5 \), \( y\) is between - 3 and 0) to \( y = 0 \) at \( x = 1 \) and then to \( y = 3 \) at \( x = 2 \)). So the rate of change is positive.
Wait, but wait, let's re - evaluate the first interval. Wait, the question is about negative rate of change (function is decreasing). The function is decreasing when \( x \) is in the interval where as \( x \) increases, \( f(x) \) decreases. The vertex is at \( x = 0 \). So for \( x<0 \), as \( x \) increases (moves towards 0), \( f(x) \) decreases. But let's check the interval - 1.5 to 0.5. In this interval, when \( x \) goes from - 1.5 to 0, \( f(x) \) decreases (since we are moving towards the minimum), and when \( x \) goes from 0 to 0.5, \( f(x) \) increases. So the function is not decreasing throughout - 1.5 to 0.5. The interval - 2 to - 1: as \( x \) increases from - 2 to - 1, \( f(x) \) goes from 3 to 0 (decreasing). But wait, the correct interval should be the one where the function is decreasing. Wait, but the vertex is at \( x = 0 \). So the function is decreasing on \( (-\infty,0) \) and increasing on \( (0,\infty) \). So we need an interval that is entirely within \( (-\infty,0) \) for the function to be decreasing (negative rate of change). The interval - 2 to - 1 is within \( (-\infty,0) \)? Wait, - 2 to - 1 is from \( x=-2 \) to \( x=-1 \), which is less than 0. But wait, the interval - 1.5 to 0.5: part of it is less than 0 and part is greater than 0. The interval 0 to 1 is greater than 0 (function increasing), 0.5 to 1.5 is greater than 0 (function increasing). Wait, but let's check the values again. At \( x=-2 \), \( y = 3 \); \( x=-1 \), \( y = 0 \); \( x = 0 \), \( y=-3 \); \( x = 1 \), \( y = 0 \); \( x = 2 \), \( y = 3 \). So:
- For interval - 2 to - 1: \( x \) increases from - 2 to - 1, \( y \) decreases from 3 to 0 (rate of change is negative? Wait, no, wait. Wait, the rate of change is \( \frac{\Delta y}{\Delta x}=\frac{f(-1)-f(-2)}{-1 - (-2)}=\frac{0 - 3}{1}=-3<0 \), so negative rate of change. But wait, the interval - 1.5 to 0.5: \( \Delta x=0.5-(-1.5) = 2 \), \( \Delta y=f(0.5)-f(-1.5) \). \( f(-1.5) \): since the parabola is \( y=x^{2}-3 \) (because when \( x = 0 \), \( y=-3 \); \( x = 1 \), \( y=1 - 3=-2 \)? Wait, no, the graph shows that at \( x = 1 \), \( y = 0 \). Wait, maybe the equation is \( y=(x - 0)^{2}-3=x^{2}-3 \)? But when \( x = 1 \), \( y=1 - 3=-2
eq0 \). So my initial assumption about the equation is wrong. Looking at the graph, when \( x = 1 \), \( y = 0 \); \( x=-1 \), \( y = 0 \); \( x = 0 \), \( y=-3 \); \( x = 2 \), \( y = 3 \); \( x=-2 \), \( y = 3 \). So the equation is \( y=(x - 1)(x + 1)-3=x^{2}-1 - 3=x^{2}-4 \)? Wait, when \( x = 0 \), \( y=-4 \)? No, the graph shows \( y=-3 \) at \( x = 0 \). Maybe \( y=(x)^{2}-3 \), but when \( x = 1 \), \( y=1 - 3=-2 \), but the graph shows \( y = 0 \) at \( x = 1 \). I think I misread the graph. Let's re - read the graph: the points are at \( (-2,3) \), \( (-1,0) \), \( (0,-3) \), \( (1,0) \), \( (2,3) \). So the function is \( y=(x)^{2}-3 \)? No, because when \( x = 1 \), \( y=1 - 3=-2
eq0 \). Wait, the points at \( x=-1 \) and \( x = 1 \) are on the x - axis, so \( f(-1)=0 \) and \( f(1)=0 \), and \( f(0)=-3 \), \( f(-2)=3 \), \( f(2)=3 \). So the function is \( y=(x - 0)^{2}-3+0 \)? No, using the vertex form \( y=a(x - h)^{2}+k \), where \( (h,k)=(0,-3) \), and the function passes through \( (1,0) \). So \( 0=a(1 - 0)^{2}-3\Rightarrow a = 3 \). So the function is \( y = 3x^{2}-3 \). Let's check: when \( x = 1 \), \( y=3(1)^{2}-3=0 \), correct. When \( x=-1 \), \( y=3(-1)^{2}-3 = 0 \), correct. When \( x = 2 \), \( y=3(4)-3 = 9 \)? No, the graph shows \( y = 3 \) at \( x = 2 \). Oh, I see, I misread the graph. The point at \( x = 2 \) is \( (2,3) \), so when \( x = 2 \), \( y = 3 \). So using \( (2,3) \) in \( y=a(x)^{2}+k \), with \( (0,k)=(0,-3) \), so \( 3=a(2)^{2}-3\Rightarrow4a=6\Rightarrow a=\frac{3}{2} \). So \( y=\frac{3}{2}x^{2}-3 \). When \( x = 1 \), \( y=\frac{3}{2}(1)-3=\frac{3 - 6}{2}=-\frac{3}{2}
eq0 \). So my graph reading is wrong. The correct points: the parabola crosses the x - axis at \( x=-1 \) and \( x = 1 \), has a minimum at \( (0,-3) \), and passes through \( (-2,3) \) and \( (2,3) \). So the function is \( y = 3x^{2}-3 \) (since when \( x = 2 \), \( y=3(4)-3 = 9
eq3 \)). I think the graph is drawn with a grid where each square is 1 unit. So at \( x=-2 \), the y - coordinate is 3; \( x=-1 \), y = 0; \( x = 0 \), y=-3; \( x = 1 \), y = 0; \( x = 2 \), y = 3. So the function is \( y=(x)^{2}-3 \) is wrong, \( y = 3x^{2}-3 \) is wrong. It's \( y = 3(x^{2}-1) \) when \( x=\pm2 \), \( y = 3(4 - 1)=9 \), which is not 3. So maybe the vertical scale is different. Anyway, back to the rate of change. A negative rate of change means that as \( x \) increases, \( y \) decreases. So we need to find the interval where, as \( x \) goes from the left end to the right end, \( y \) goes down.
- Interval - 2 to - 1: \( x \) increases from - 2 to - 1, \( y \) goes from 3 to 0 (decreasing, so rate of change negative? Wait, 3 to 0 is a decrease, so \( \frac{0 - 3}{-1-(-2)}=\frac{-3}{1}=-3<0 \), negative rate of change.
- Interval - 1.5 to 0.5: \( x \) increases from - 1.5 to 0.5. At \( x=-1.5 \), \( y \) is, let's say, using the symmetry, since at \( x=-2 \), \( y = 3 \), \( x=-1 \), \( y = 0 \), so at \( x=-1.5 \), \( y \) is between 0 and 3. At \( x = 0.5 \), \( y \) is between - 3 and 0 (since at \( x = 0 \), \( y=-3 \) and \( x = 1 \), \( y = 0 \)). So as \( x \) increases from - 1.5 to 0.5, \( y \) first decreases (from - 1.5 to 0) and then increases (from 0 to 0.5). So the overall rate of change: \( \Delta x=0.5-(-1.5)=2 \), \( \Delta y=f(0.5)-f(-1.5) \). Since \( f(-1.5)>f(0.5) \)? Wait, no, \( f(-1.5) \) is positive (between 0 and 3) and \( f(0.5) \) is negative (between - 3 and 0), so \( f(0.5)-f(-1.5) \) is negative - positive = negative. Wait, but the function is decreasing then increasing. But the question is about the rate of change of the function, which is the slope of the secant line. The slope of the secant line between \( x=-1.5 \) and \( x = 0.5 \) is \( \frac{f(0.5)-f(-1.5)}{0.5-(-1.5)} \). If \( f(-1.5)=1.5 \) (for example) and \( f(0.5)=-1.5 \), then the slope is \( \frac{-1.5 - 1.5}{2}=\frac{-3}{2}<0 \). But that's not correct because the function has a minimum at \( x = 0 \). Wait, I think I made a mistake earlier. The correct approach: the function is a parabola opening upwards with vertex at \( (0,-3) \). So the function is decreasing on the interval \( (-\infty,0) \) and increasing on \( (0,\infty) \). So any interval that is entirely within \( (-\infty,0) \) will have a negative rate of change (since as \( x \) increases towards 0, \( y \) decreases), and any interval entirely within \( (0,\infty) \) will have a positive rate of change (as \( x \) increases, \( y \) increases). Intervals that cross \( x = 0 \) will have a rate of change that depends on the two parts.
- Interval - 2 to - 1: entirely within \( (-\infty,0) \), so the function is decreasing (negative rate of change).
- Interval - 1.5 to 0.5: crosses \( x = 0 \) (from \( x=-1.5<0 \) to \( x = 0.5>0 \)), so the function decreases then increases, so the rate of change is not negative throughout.
- Interval 0 to 1: entirely within \( (0,\infty) \), function is increasing (positive rate of change).
- Interval 0.5 to 1.5: entirely within \( (0,\infty) \), function is increasing (positive rate of change).
Wait, but earlier when I calculated the slope for - 2 to - 1, I got a negative slope. But let's check the other option - 1.5 to 0.5. Wait, maybe I was wrong about the vertex. Wait, the graph is symmetric about the y - axis, with minimum at \( (0,-3) \). So for \( x<0 \), as \( x \) increases (moves towards 0), \( y \) decreases. For \( x>0 \), as \( x \) increases (moves away from 0), \( y \) increases. So the interval where the function is decreasing is \( (-\infty,0) \), and increasing is \( (0,\infty) \). So we need an interval that is a subset of \( (-\infty,0) \) for negative rate of change. The interval - 2 to - 1 is a subset of \( (-\infty,0) \), - 1.5 to 0.5 is not (since 0.5>0), 0 to 1 and 0.5 to 1.5 are subsets of \( (0,\infty) \). But wait, the option - 1.5 to 0.5: when \( x=-1.5 \), \( y \) is, say, 1.5 (since at \( x=-2 \), \( y = 3 \); \( x=-1 \), \( y = 0 \), so linear approximation: slope from -