QUESTION IMAGE
Question
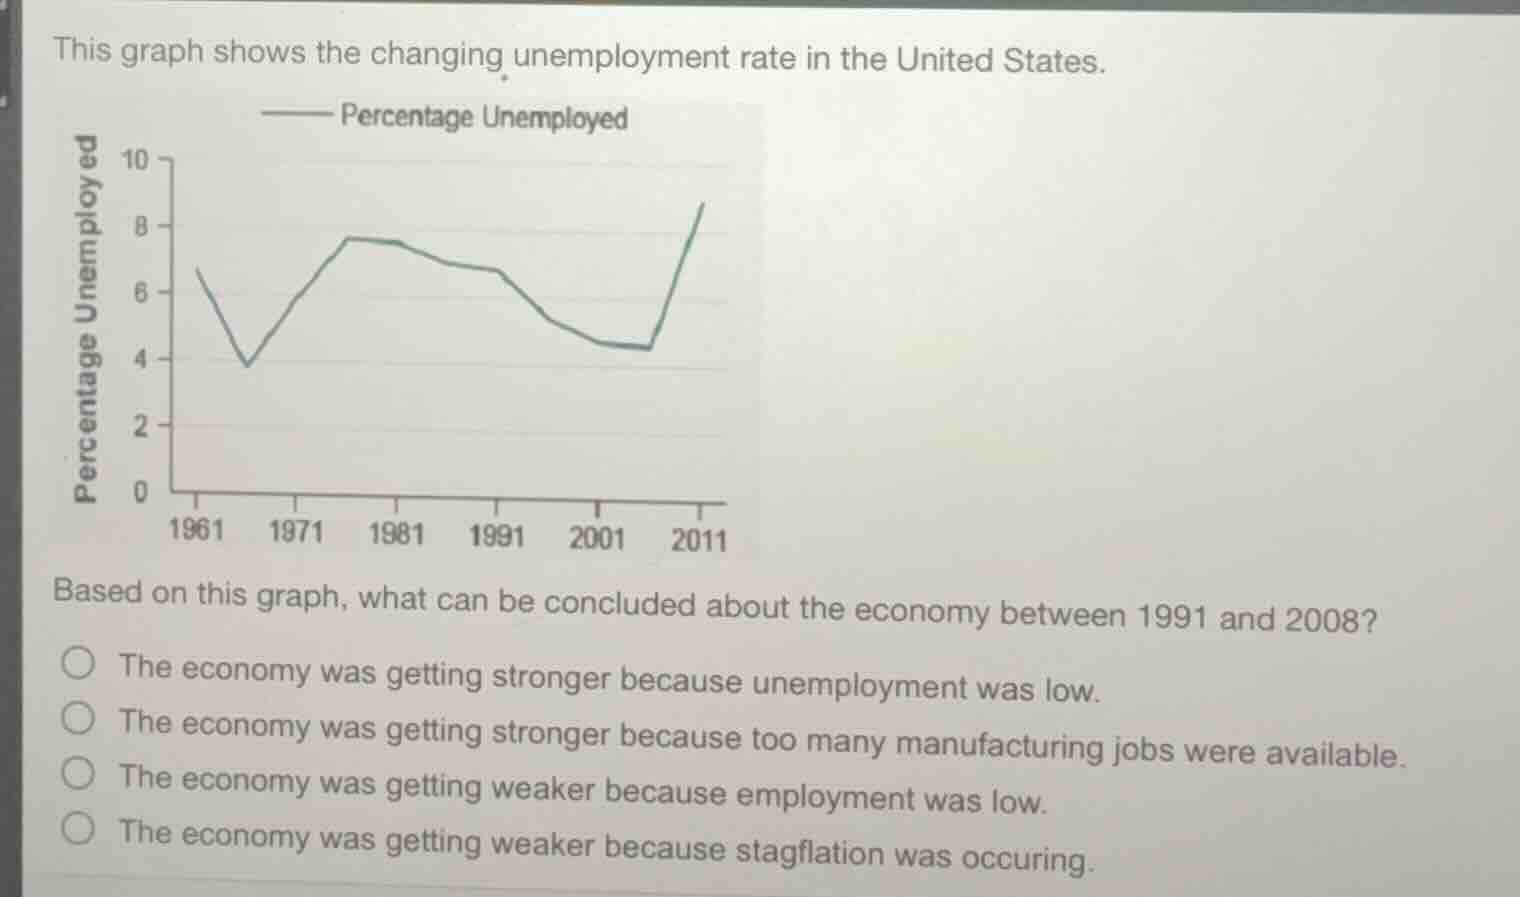
this graph shows the changing unemployment rate in the united states.
based on this graph, what can be concluded about the economy between 1991 and 2008?
the economy was getting stronger because unemployment was low.
the economy was getting stronger because too many manufacturing jobs were available.
the economy was getting weaker because employment was low.
the economy was getting weaker because stagflation was occuring.
Brief Explanations
To solve this, we analyze the graph and options:
- Analyze the graph: From 1991 to 2008 (before the sharp rise around 2008 - 2011), the unemployment rate decreases (from ~6 - 7% to ~4%).
- Relate unemployment to economy: Lower unemployment generally indicates a stronger economy (more people employed, businesses thriving).
- Evaluate options:
- Option 1: Matches (lower unemployment → stronger economy).
- Option 2: The graph doesn’t show data about manufacturing jobs, so this is unsupported.
- Option 3: Lower unemployment means employment is high, so “employment was low” is wrong.
- Option 4: Stagflation (high inflation + high unemployment) isn’t indicated here (unemployment is falling), so this is wrong.

Snap & solve any problem in the app
Get step-by-step solutions on Sovi AI
Photo-based solutions with guided steps
Explore more problems and detailed explanations
A. The economy was getting stronger because unemployment was low.