QUESTION IMAGE
Question
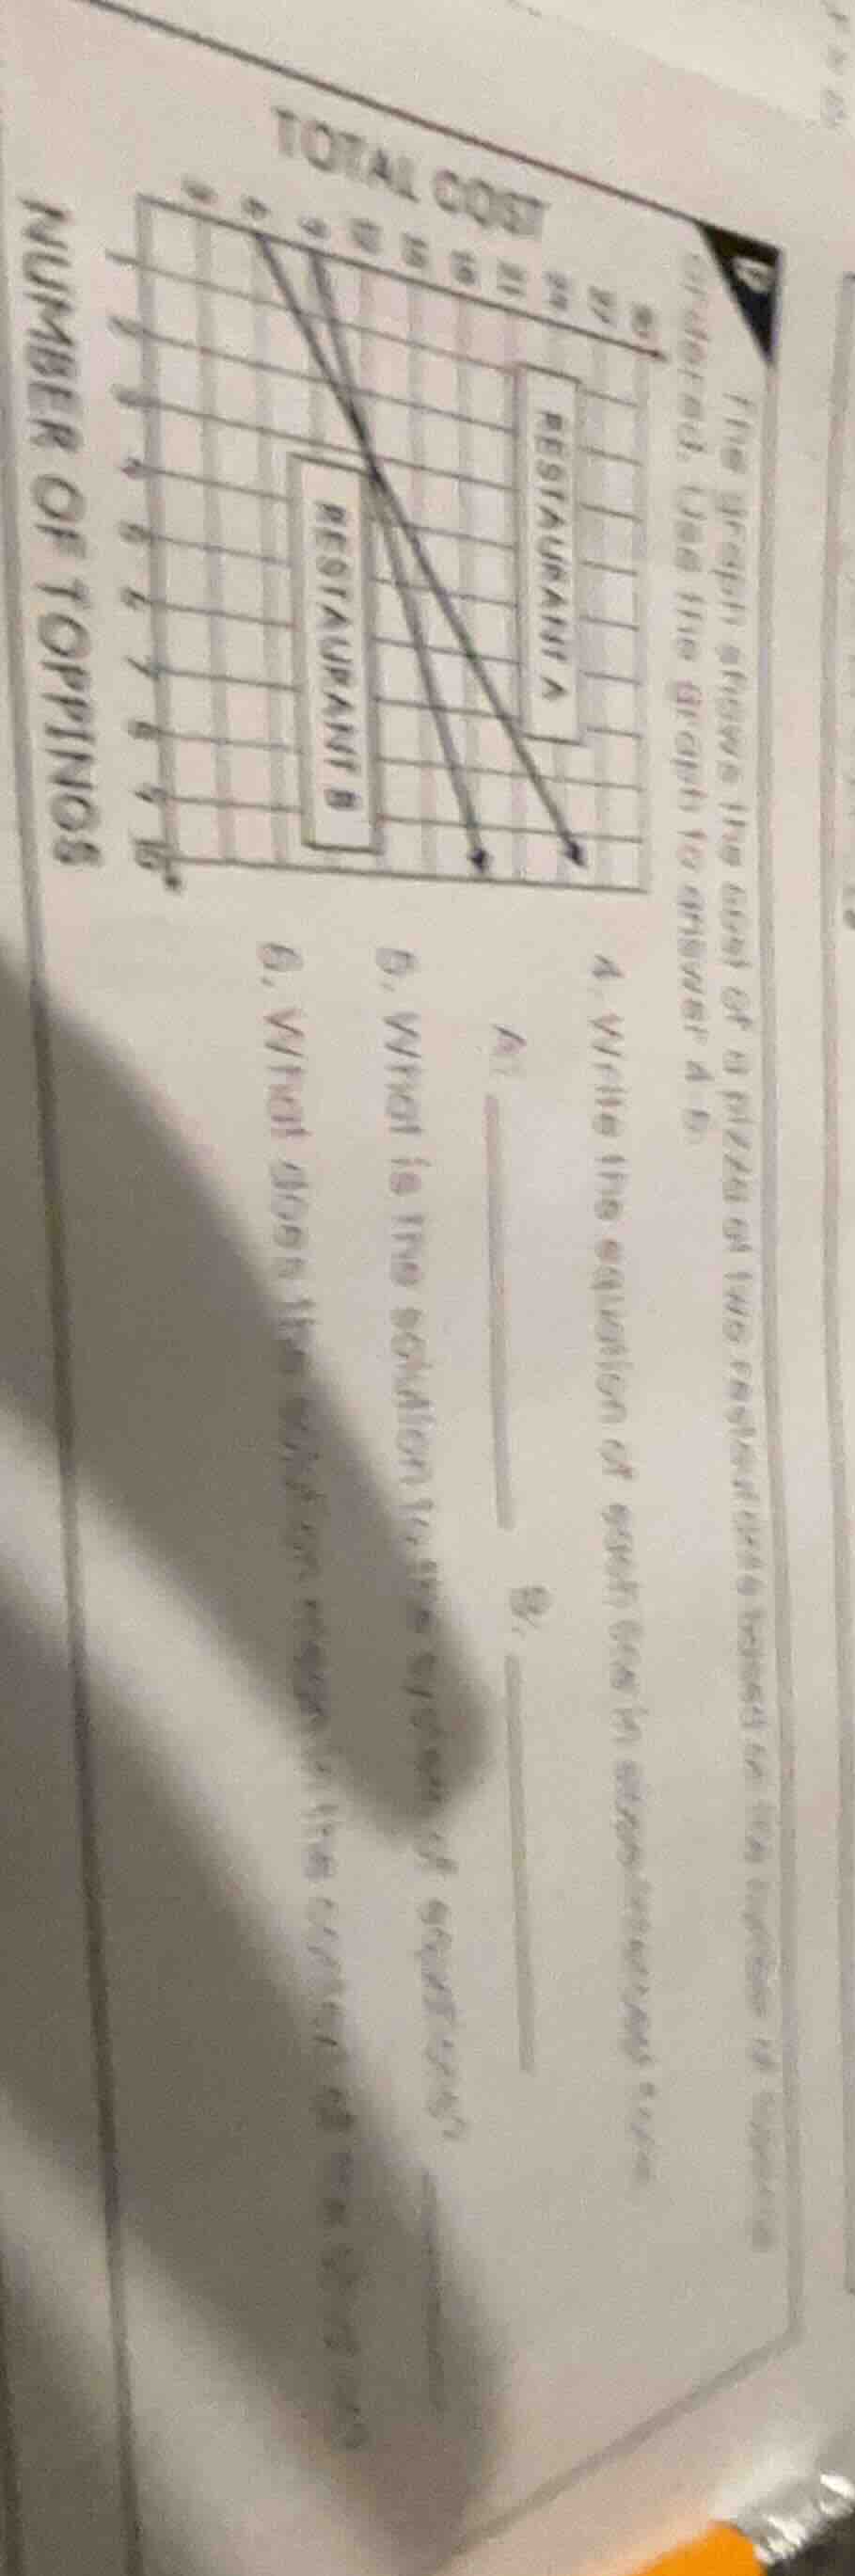
the graph shows the cost of a pizza at two different restaurants. use the graph to answer a - c. total cost number of toppings restaurant a restaurant b a. write the equation of each line in slope - intercept form. a: ____ b: ____ b. what is the solution to the system of equations? c. what does the solution represent in the context of the problem?
Step1: Identify Restaurant A's intercept/slope
From the graph: Restaurant A has a y-intercept (cost with 0 toppings) of $\$20$, and each topping adds $\$2$. Slope-intercept form is $y=mx+b$, where $m$ is slope, $b$ is intercept.
Expression: $y = 2x + 20$
Step2: Identify Restaurant B's intercept/slope
From the graph: Restaurant B has a y-intercept of $\$16$, and each topping adds $\$3$.
Expression: $y = 3x + 16$
Step3: Find intersection (solution)
Set equations equal: $2x + 20 = 3x + 16$
Solve for $x$: $20 - 16 = 3x - 2x$ → $x=4$
Substitute $x=4$ into $y=2x+20$: $y=2(4)+20=28$
Step4: Interpret the solution
The intersection means equal cost at that topping count.

Snap & solve any problem in the app
Get step-by-step solutions on Sovi AI
Photo-based solutions with guided steps
Explore more problems and detailed explanations
4.
A: $y = 2x + 20$
B: $y = 3x + 16$
- The solution is $(4, 28)$
- The solution means that a pizza with 4 toppings costs $\$28$ at both restaurants.