QUESTION IMAGE
Question
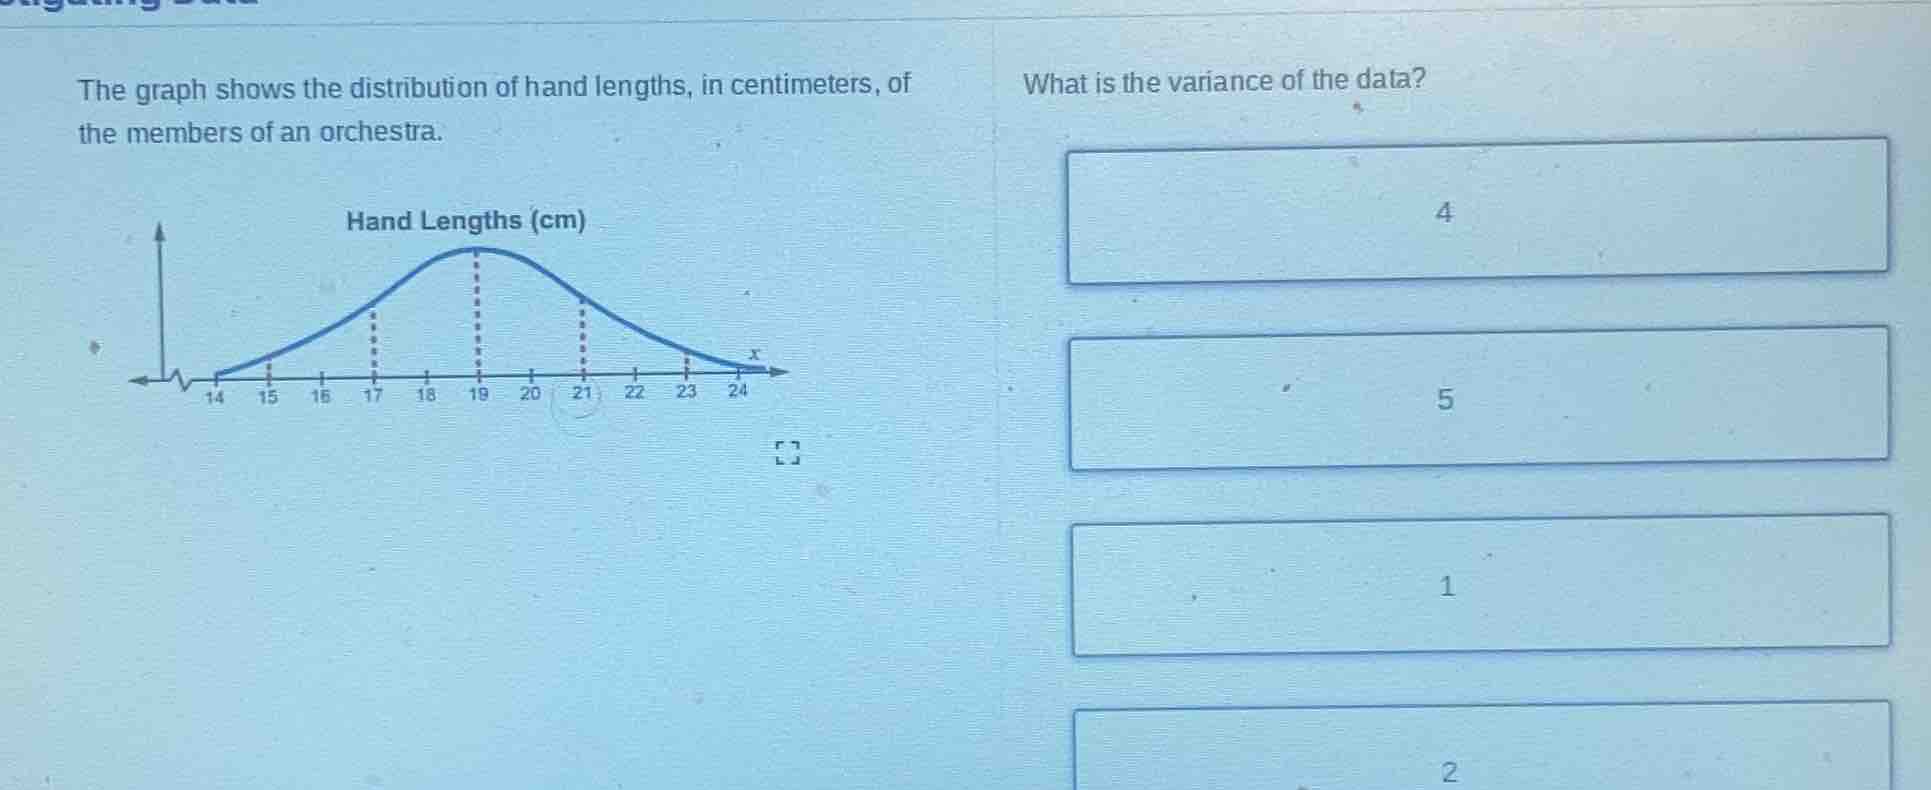
the graph shows the distribution of hand lengths, in centimeters, of the members of an orchestra. hand lengths (cm) what is the variance of the data? 4 5 1 2
Step1: Identify the distribution type
The graph is a normal distribution curve. For a normal distribution, we can estimate the variance by looking at the spread of the data. The peak is at 19, and the data seems to be symmetric around 19. Let's assume the data points are at 17, 19, 21 (since the dashed lines are at 17, 19, 21, maybe representing key points like mean - 2, mean, mean + 2? Wait, maybe the standard deviation is 2, so variance is standard deviation squared. Wait, maybe the data has a mean of 19, and the points are 17 (19 - 2), 19 (mean), 21 (19 + 2). So the differences from the mean: 17 - 19 = -2, 19 - 19 = 0, 21 - 19 = 2. But maybe the variance is calculated as the average of squared differences. Wait, maybe the options are 4, 5, 1, 2. Let's think again. If the standard deviation is 2, variance is \(2^2 = 4\). So that's likely.
Step2: Calculate variance (or identify from options)
Assuming the standard deviation is 2 (since the data spreads from 17 to 21 around mean 19, which is 2 units away), variance is standard deviation squared, so \(2^2 = 4\).

Snap & solve any problem in the app
Get step-by-step solutions on Sovi AI
Photo-based solutions with guided steps
Explore more problems and detailed explanations
4