QUESTION IMAGE
Question
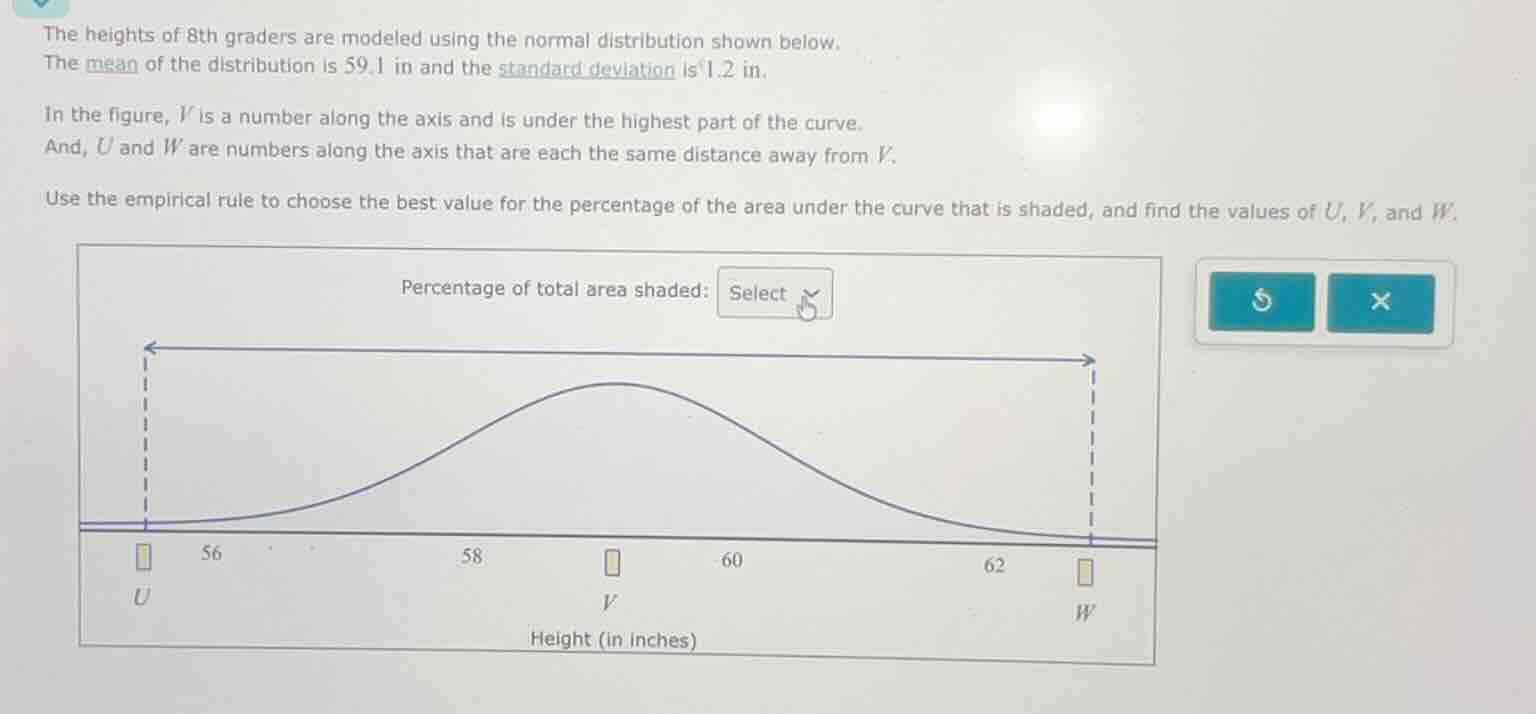
the heights of 8th graders are modeled using the normal distribution shown below. the mean of the distribution is 59.1 in and the standard deviation is 1.2 in. in the figure, v is a number along the axis and is under the highest part of the curve. and, u and w are numbers along the axis that are each the same distance away from v. use the empirical rule to choose the best value for the percentage of the area under the curve that is shaded, and find the values of u, v, and w. percentage of total area shaded: select u 56 58 v 60 62 w height (in inches)
Step1: Identify V (mean value)
The highest part of the normal curve corresponds to the mean, so $V = 59.1$
Step2: Calculate U (mean - 3σ)
U is 3 standard deviations below the mean:
$U = 59.1 - 3\times1.2 = 59.1 - 3.6 = 55.5$
Step3: Calculate W (mean + 3σ)
W is 3 standard deviations above the mean:
$W = 59.1 + 3\times1.2 = 59.1 + 3.6 = 62.7$
Step4: Apply empirical rule for area
The empirical rule states that ~99.7% of data lies within $\mu\pm3\sigma$, which matches the shaded range U to W.

Snap & solve any problem in the app
Get step-by-step solutions on Sovi AI
Photo-based solutions with guided steps
Explore more problems and detailed explanations
Percentage of total area shaded: 99.7%
$U = 55.5$ in, $V = 59.1$ in, $W = 62.7$ in