QUESTION IMAGE
Question
initial knowledge check
question 2
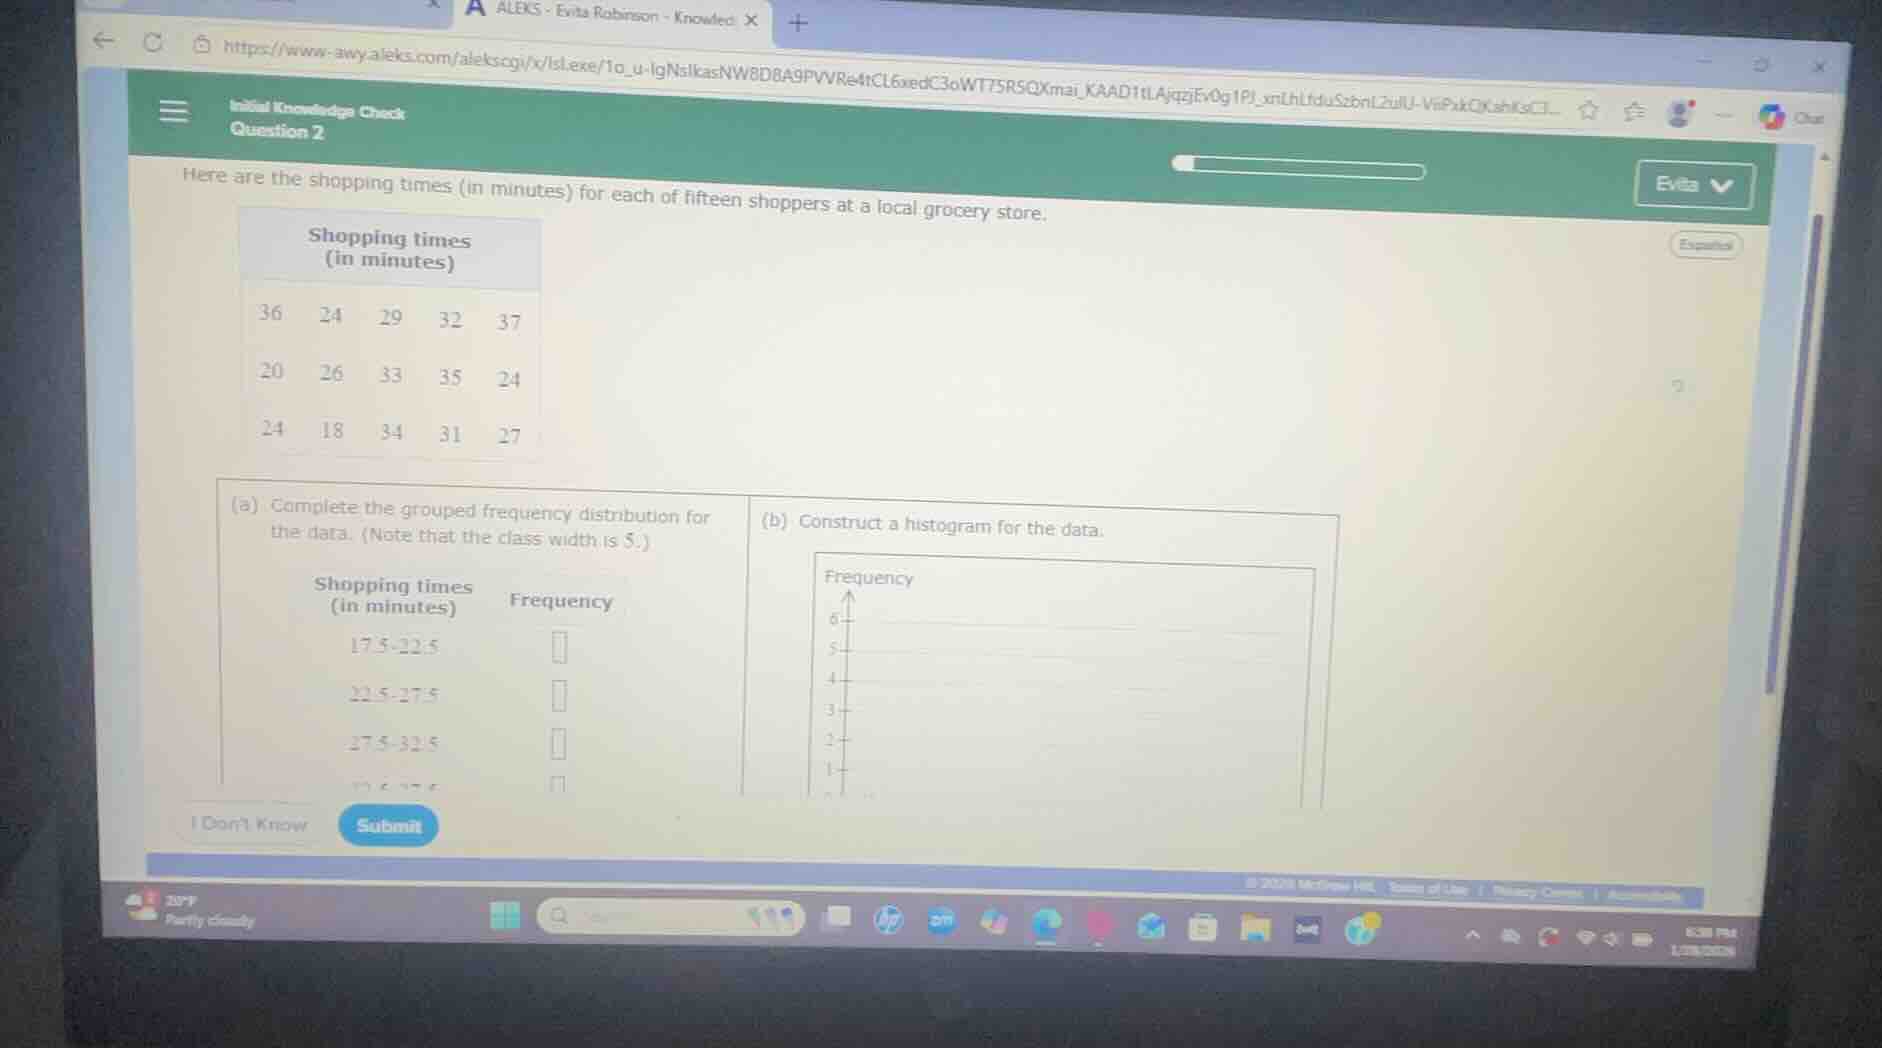
here are the shopping times (in minutes) for each of fifteen shoppers at a local grocery store.
shopping times
(in minutes)
36 24 29 32 37
20 26 33 35 24
24 18 34 31 27
(a) complete the grouped frequency distribution for
the data. (note that the class width is 5.)
shopping times
(in minutes) frequency
17.5 - 22.5
22.5 - 27.5
27.5 - 32.5
(b) construct a histogram for the data.
frequency
Step1: List all data points
Data: 18, 20, 24, 24, 24, 26, 27, 29, 31, 32, 33, 34, 35, 36, 37
Step2: Count 17.5-22.5 values
Values in range: 18, 20
Frequency = $2$
Step3: Count 22.5-27.5 values
Values in range: 24, 24, 24, 26, 27
Frequency = $5$
Step4: Count 27.5-32.5 values
Values in range: 29, 31, 32
Frequency = $3$
Step5: Count 32.5-37.5 values
Values in range: 33, 34, 35, 36, 37
Frequency = $5$

Snap & solve any problem in the app
Get step-by-step solutions on Sovi AI
Photo-based solutions with guided steps
Explore more problems and detailed explanations
(a) Grouped Frequency Distribution:
| Shopping times (in minutes) | Frequency |
|---|---|
| 22.5-27.5 | 5 |
| 27.5-32.5 | 3 |
| 32.5-37.5 | 5 |
(b) Histogram Guidelines:
- On the x-axis, mark the class intervals: 17.5-22.5, 22.5-27.5, 27.5-32.5, 32.5-37.5
- On the y-axis, mark frequency values 1-6
- Draw bars for each interval with heights equal to their frequencies:
- 17.5-22.5: height = 2
- 22.5-27.5: height = 5
- 27.5-32.5: height = 3
- 32.5-37.5: height = 5