QUESTION IMAGE
Question
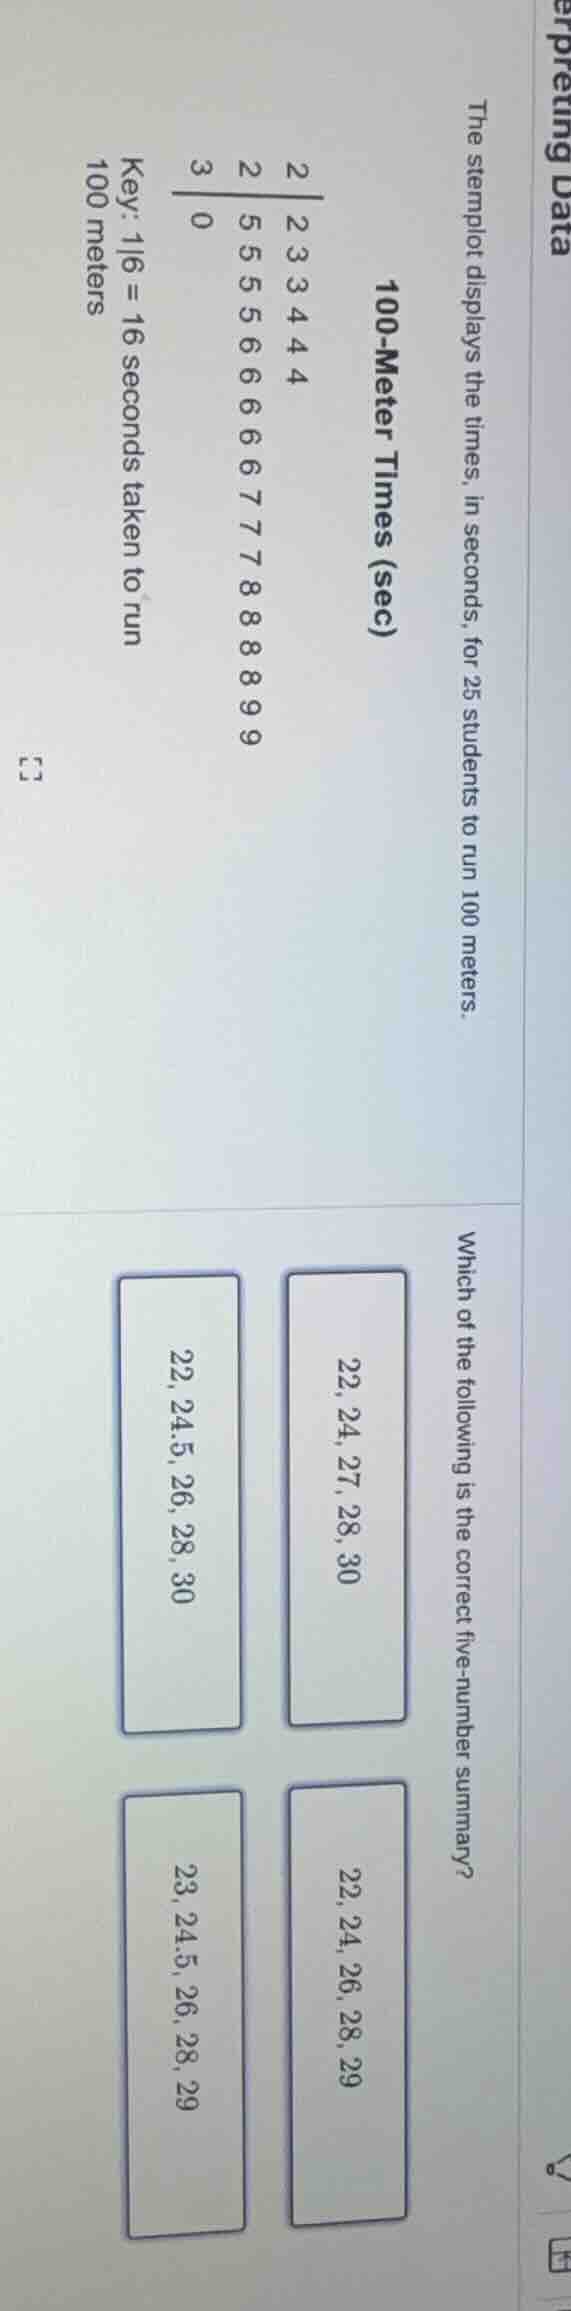
interpreting data
100-meter times (sec)
the stemplot displays the times, in seconds, for 25 students to run 100 meters.
key: 1|6 = 16 seconds taken to run 100 meters
2 | 2 3 3 3 4 4 4 4
2 | 5 5 5 5 5 6 6 6 6 6 6 7 7 7 7 8 8 8 8 8 9 9
3 | 0
which of the following is the correct five - number summary?
22, 24, 27, 28, 30
22, 24, 26, 28, 29
22, 24.5, 26, 28, 30
23, 24.5, 26, 28, 29
Step1: List all data values
From the stemplot: 22, 23, 23, 24, 24, 24, 25, 25, 25, 25, 26, 26, 26, 26, 26, 27, 27, 28, 28, 28, 28, 29, 29, 30
Step2: Find minimum value
The smallest value is 22.
Step3: Find Q1 (25th percentile)
Position: $\frac{25}{100} \times 25 = 6.25$, so 7th value: 25. Wait, correct position for n=25: Q1 is value at $\frac{n+1}{4} = \frac{26}{4}=6.5$, average of 6th and 7th values: $\frac{24+25}{2}=24.5$
Step4: Find median (50th percentile)
Position: $\frac{25+1}{2}=13$th value: 26
Step5: Find Q3 (75th percentile)
Position: $\frac{3(25+1)}{4}=19.5$, average of 19th and 20th values: $\frac{28+28}{2}=28$
Step6: Find maximum value
The largest value is 30.

Snap & solve any problem in the app
Get step-by-step solutions on Sovi AI
Photo-based solutions with guided steps
Explore more problems and detailed explanations
22, 24.5, 26, 28, 30