QUESTION IMAGE
Question
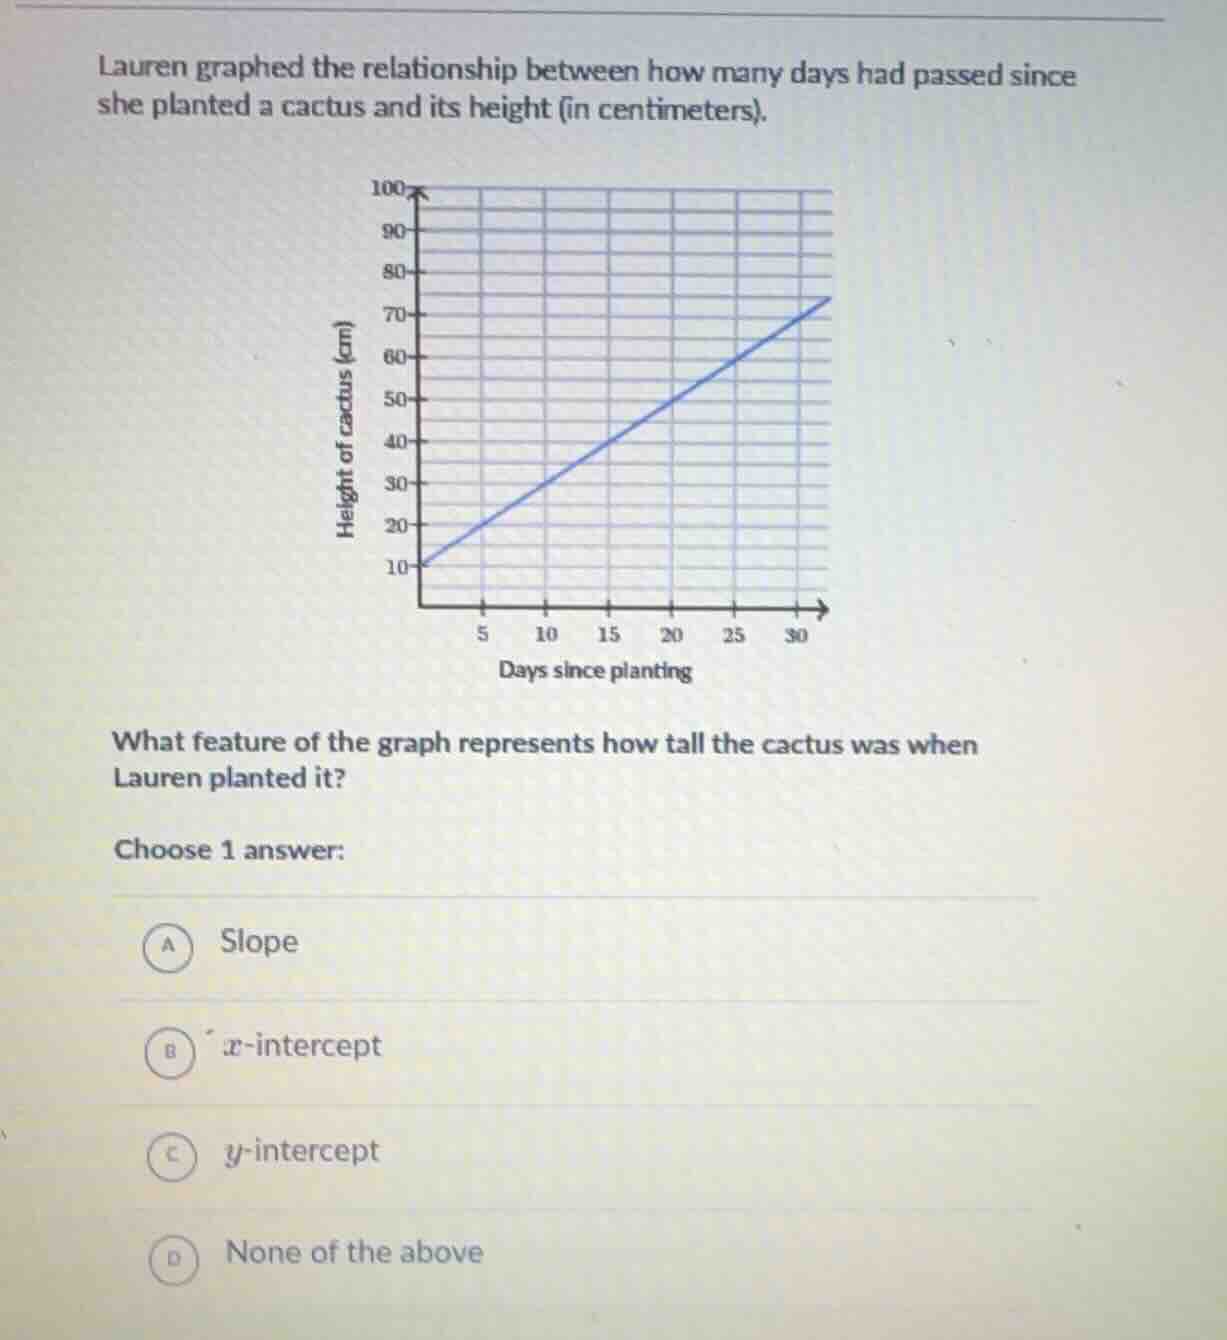
lauren graphed the relationship between how many days had passed since she planted a cactus and its height (in centimeters).
what feature of the graph represents how tall the cactus was when lauren planted it?
choose 1 answer:
a slope
b $x$-intercept
c $y$-intercept
d none of the above
Brief Explanations
The cactus's height when planted corresponds to the height at 0 days since planting. On this graph, the x-axis is days since planting, so x=0. The point where x=0 intersects the line is the y-intercept, which shows the initial height of 10 cm.

Snap & solve any problem in the app
Get step-by-step solutions on Sovi AI
Photo-based solutions with guided steps
Explore more problems and detailed explanations
C. y-intercept