QUESTION IMAGE
Question
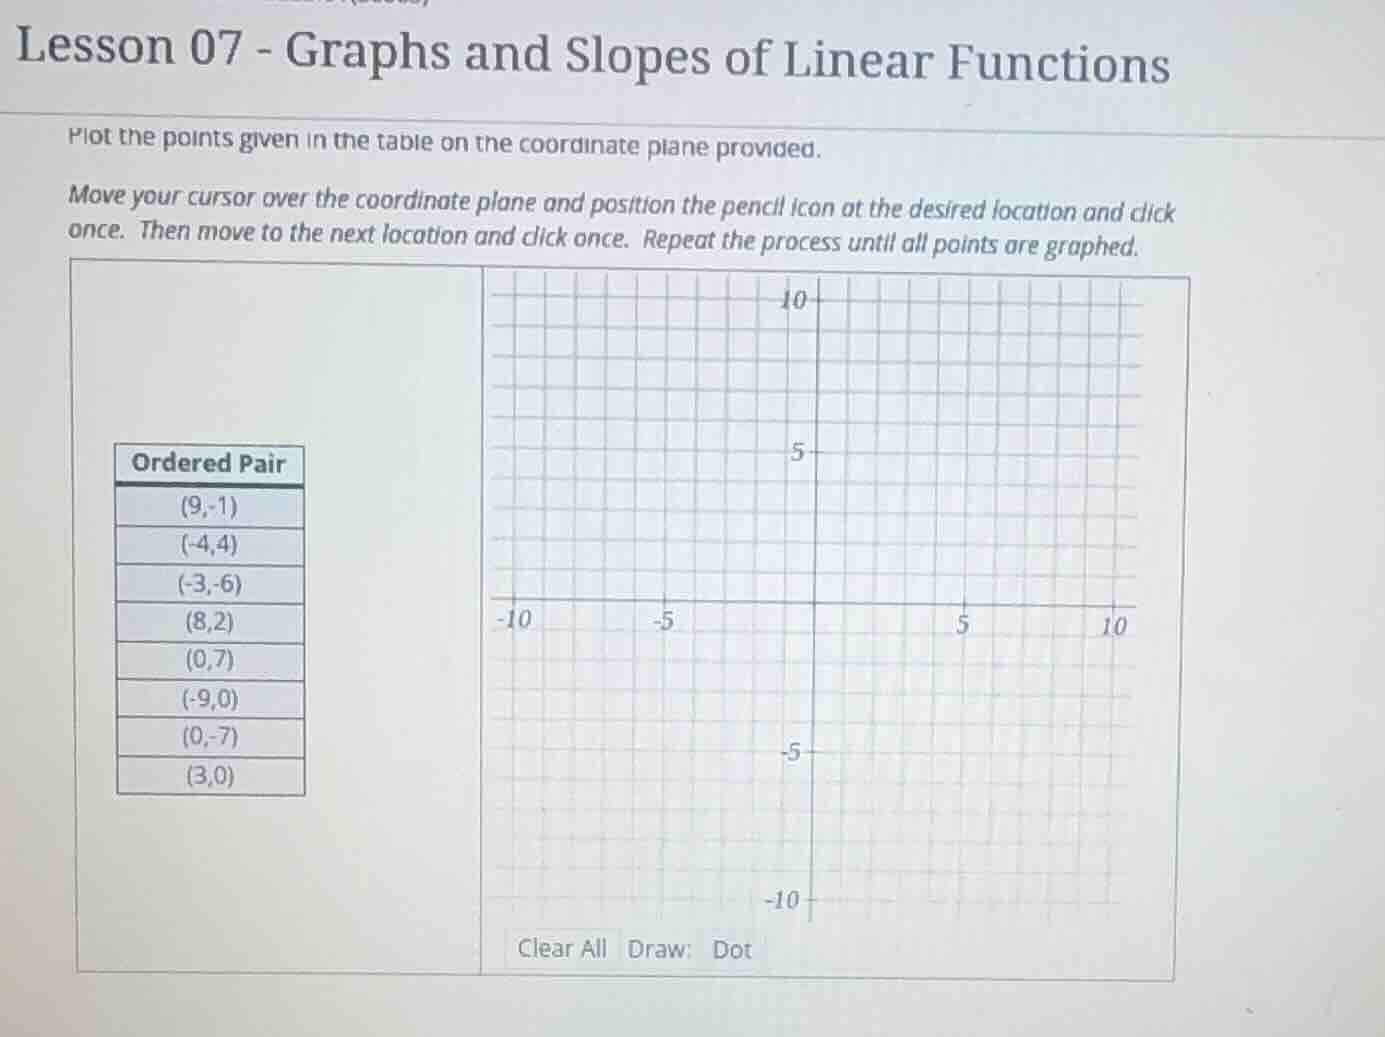
lesson 07 - graphs and slopes of linear functions
plot the points given in the table on the coordinate plane provided.
move your cursor over the coordinate plane and position the pencil icon at the desired location and click once. then move to the next location and click once. repeat the process until all points are graphed.
ordered pair
(9,-1)
(-4,4)
(-3,-6)
(8,2)
(0,7)
(-9,0)
(0,-7)
(3,0)
clear all draw: dot
Step1: Understand ordered pairs
Each ordered pair $(x,y)$ means:
- $x$: horizontal distance from origin (right positive, left negative)
- $y$: vertical distance from origin (up positive, down negative)
Step2: Locate each point
- $(9,-1)$: Right 9, Down 1
- $(-4,4)$: Left 4, Up 4
- $(-3,-6)$: Left 3, Down 6
- $(8,2)$: Right 8, Up 2
- $(0,7)$: Origin x, Up 7 (y-axis)
- $(-9,0)$: Left 9, Origin y (x-axis)
- $(0,-7)$: Origin x, Down 7 (y-axis)
- $(3,0)$: Right 3, Origin y (x-axis)
Step3: Mark points on grid
Place a dot at each calculated position on the coordinate plane.

Snap & solve any problem in the app
Get step-by-step solutions on Sovi AI
Photo-based solutions with guided steps
Explore more problems and detailed explanations
The points are plotted as follows on the coordinate grid:
- $(9,-1)$: 9 units right, 1 unit down from the origin
- $(-4,4)$: 4 units left, 4 units up from the origin
- $(-3,-6)$: 3 units left, 6 units down from the origin
- $(8,2)$: 8 units right, 2 units up from the origin
- $(0,7)$: On the y-axis, 7 units up from the origin
- $(-9,0)$: On the x-axis, 9 units left from the origin
- $(0,-7)$: On the y-axis, 7 units down from the origin
- $(3,0)$: On the x-axis, 3 units right from the origin