QUESTION IMAGE
Question
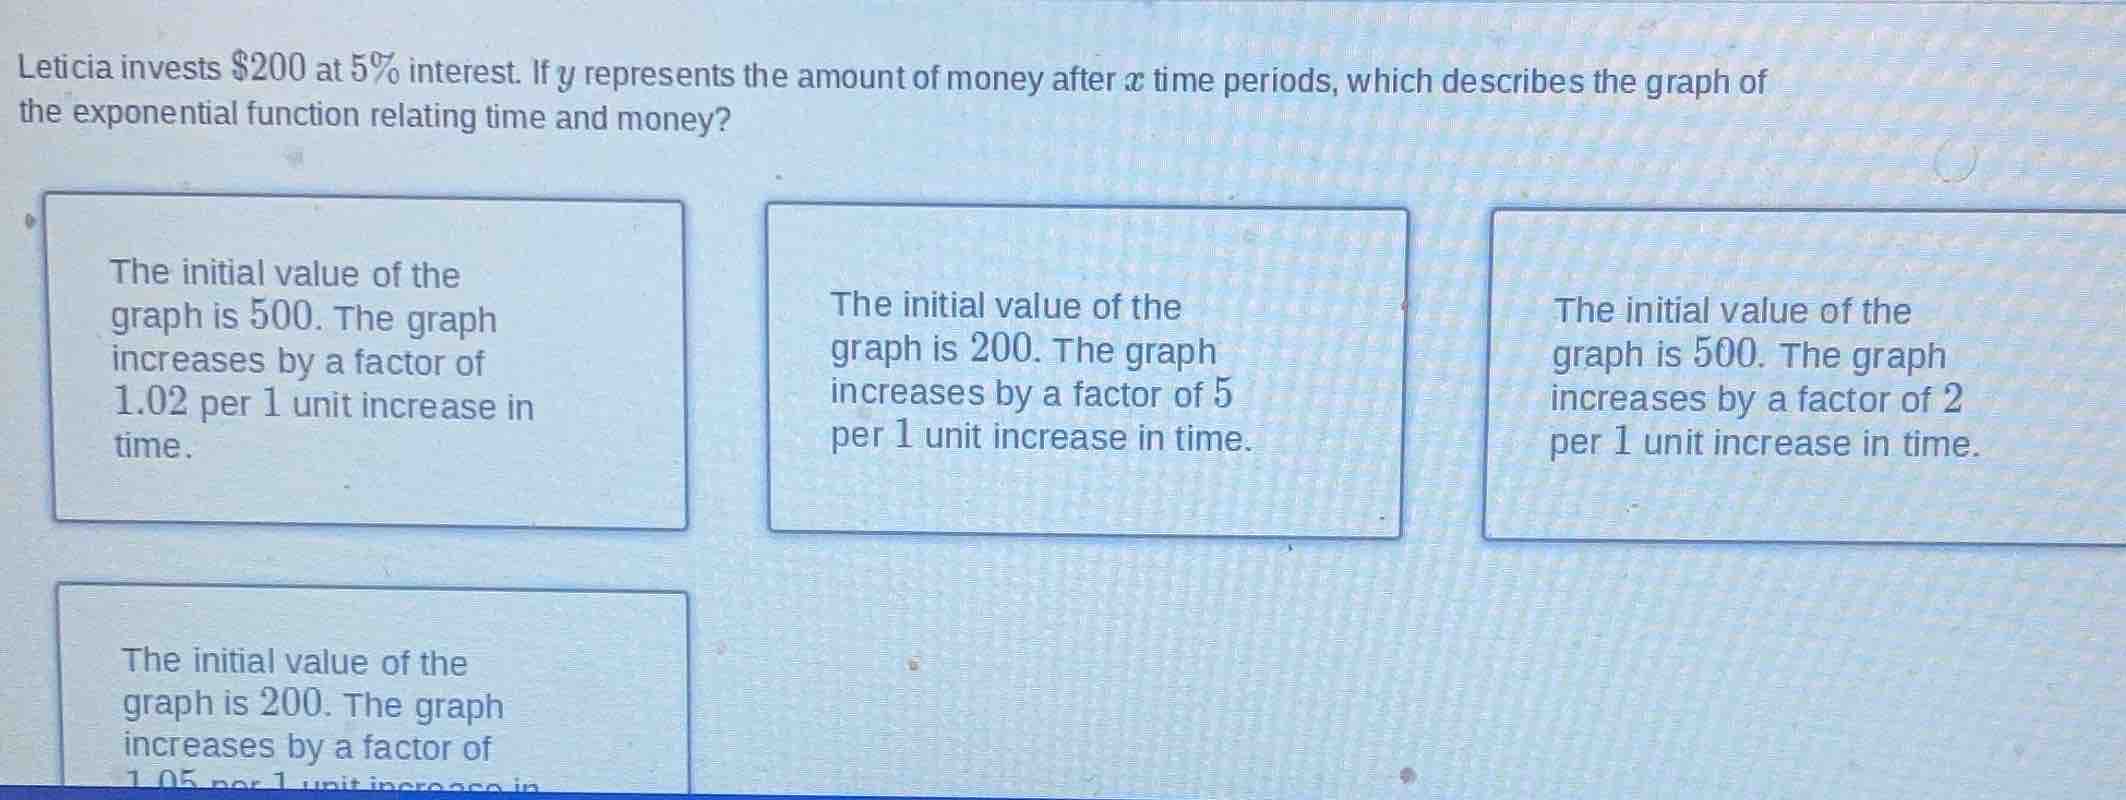
leticia invests $200 at 5% interest. if y represents the amount of money after x time periods, which describes the graph of the exponential function relating time and money? the initial value of the graph is 500. the graph increases by a factor of 1.02 per 1 unit increase in time. the initial value of the graph is 200. the graph increases by a factor of 5 per 1 unit increase in time. the initial value of the graph is 500. the graph increases by a factor of 2 per 1 unit increase in time. the initial value of the graph is 200. the graph increases by a factor of 1.05 per 1 unit increase in
Step1: Identify initial investment value
The initial amount invested is $\$200$, so the initial value of the function (when $x=0$) is 200.
Step2: Calculate growth factor
The interest rate is 5%, so the growth factor is $1 + 0.05 = 1.05$. This means the amount increases by a factor of 1.05 per time unit.
Step3: Match to correct option
The option with initial value 200 and growth factor 1.05 is the bottom-left (partially shown) option: The initial value of the graph is 200. The graph increases by a factor of 1.05 per 1 unit increase in time.

Snap & solve any problem in the app
Get step-by-step solutions on Sovi AI
Photo-based solutions with guided steps
Explore more problems and detailed explanations
The initial value of the graph is 200. The graph increases by a factor of 1.05 per 1 unit increase in time.