QUESTION IMAGE
Question
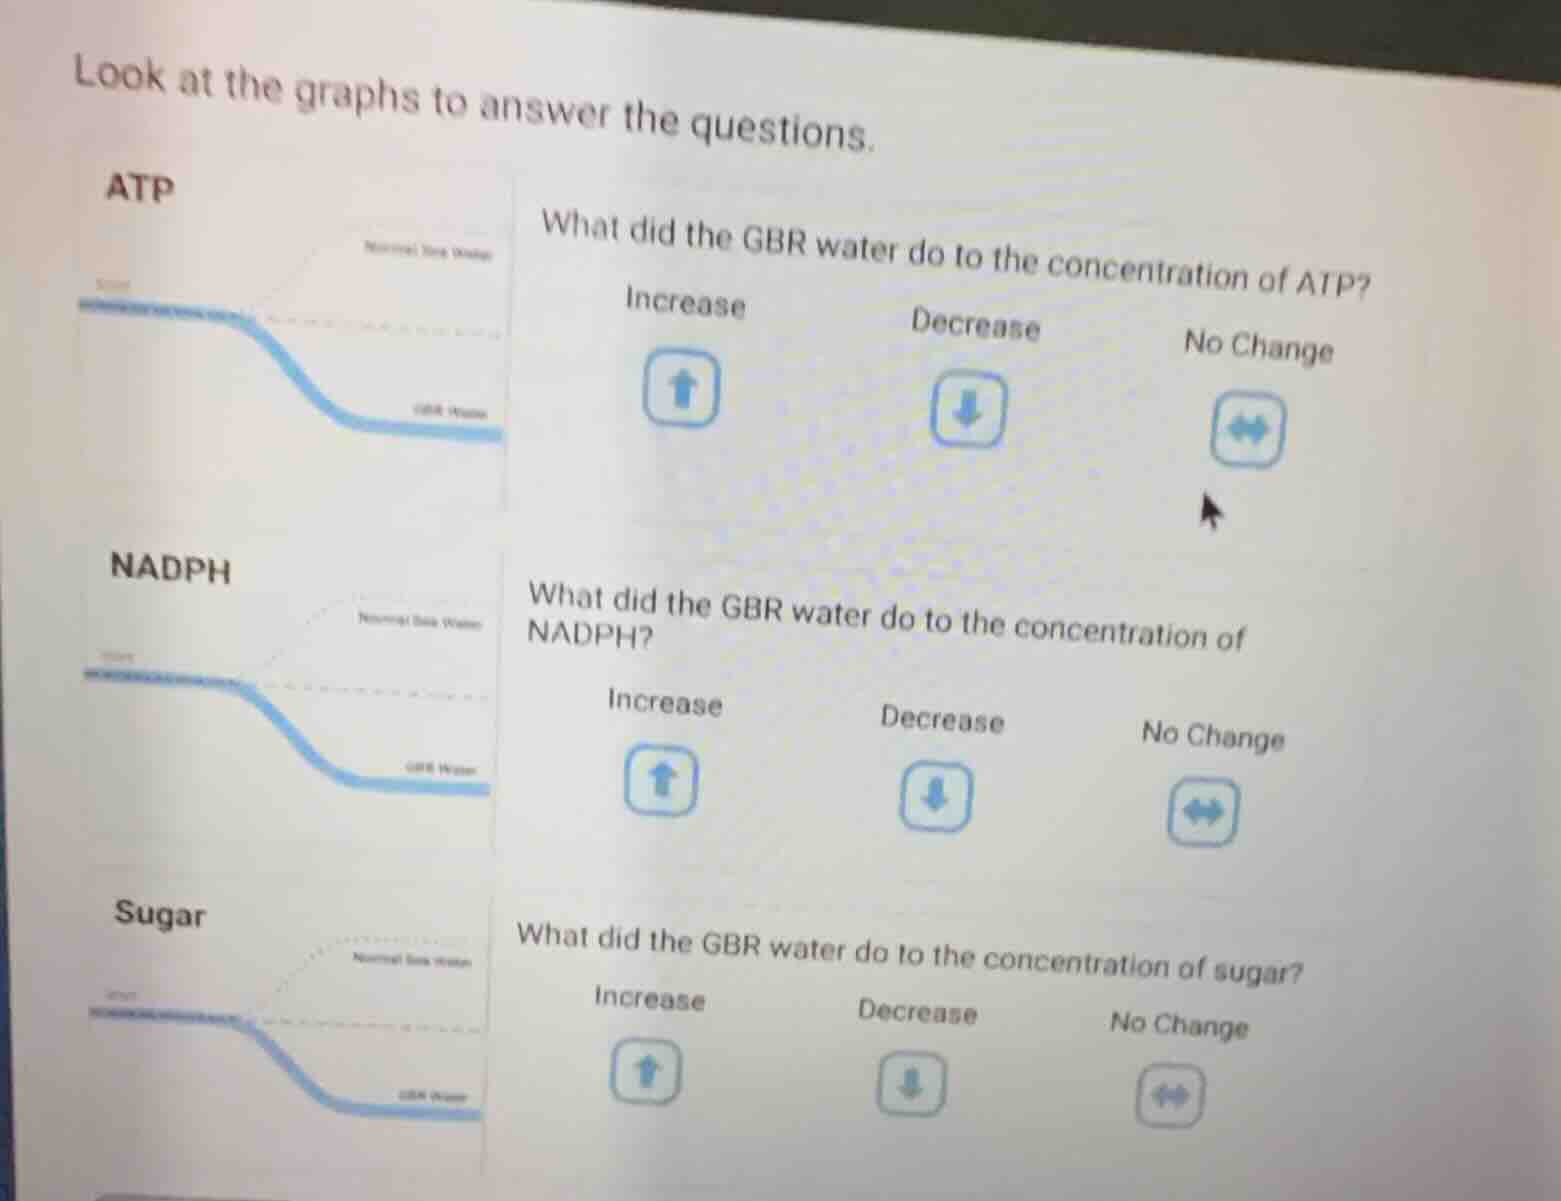
look at the graphs to answer the questions.
atp
what did the gbr water do to the concentration of atp?
increase decrease no change
nadph
what did the gbr water do to the concentration of nadph?
increase decrease no change
sugar
what did the gbr water do to the concentration of sugar?
increase decrease no change
Brief Explanations
- For ATP: Compare the "GBR Water" (solid blue line) to "Normal Sea Water" (dashed line) in the ATP graph. The solid line is lower, so concentration decreased.
- For NADPH: Compare the "GBR Water" line to the normal line in the NADPH graph. The solid line is lower, so concentration decreased.
- For Sugar: Compare the "GBR Water" line to the normal line in the Sugar graph. The solid line is lower, so concentration decreased.

Snap & solve any problem in the app
Get step-by-step solutions on Sovi AI
Photo-based solutions with guided steps
Explore more problems and detailed explanations
- ATP: Decrease (↘️)
- NADPH: Decrease (↘️)
- Sugar: Decrease (↘️)