QUESTION IMAGE
Question
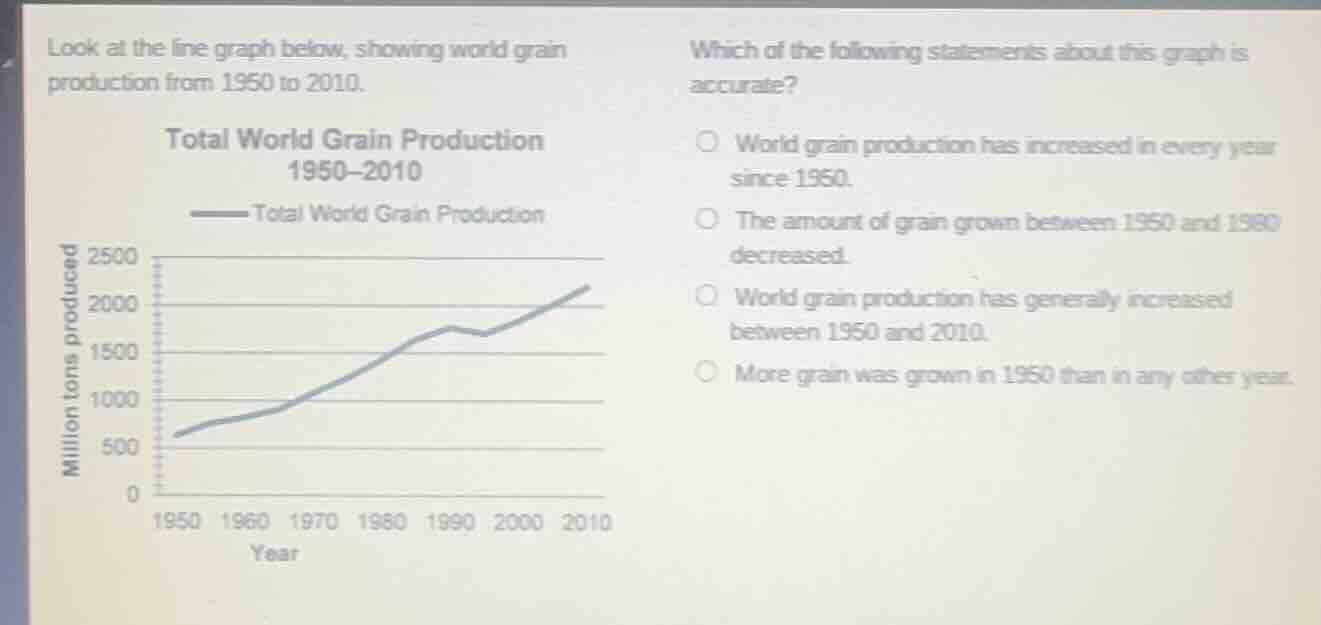
look at the line graph below, showing world grain production from 1950 to 2010.
total world grain production
1950–2010
which of the following statements about this graph is accurate?
world grain production has increased in every year since 1950.
the amount of grain grown between 1950 and 1980 decreased.
world grain production has generally increased between 1950 and 2010.
more grain was grown in 1950 than in any other year.
Brief Explanations
- Check the first statement: The line has a small dip between 1990 and 2000, so production did not increase every year.
- Check the second statement: The line rises from 1950 to 1980, so production increased, not decreased.
- Check the third statement: Overall, the line moves upward from 1950 to 2010, with only a minor temporary dip, so production generally increased.
- Check the fourth statement: The line is at its lowest point in 1950, so this is false.

Snap & solve any problem in the app
Get step-by-step solutions on Sovi AI
Photo-based solutions with guided steps
Explore more problems and detailed explanations
C. World grain production has generally increased between 1950 and 2010.