QUESTION IMAGE
Question
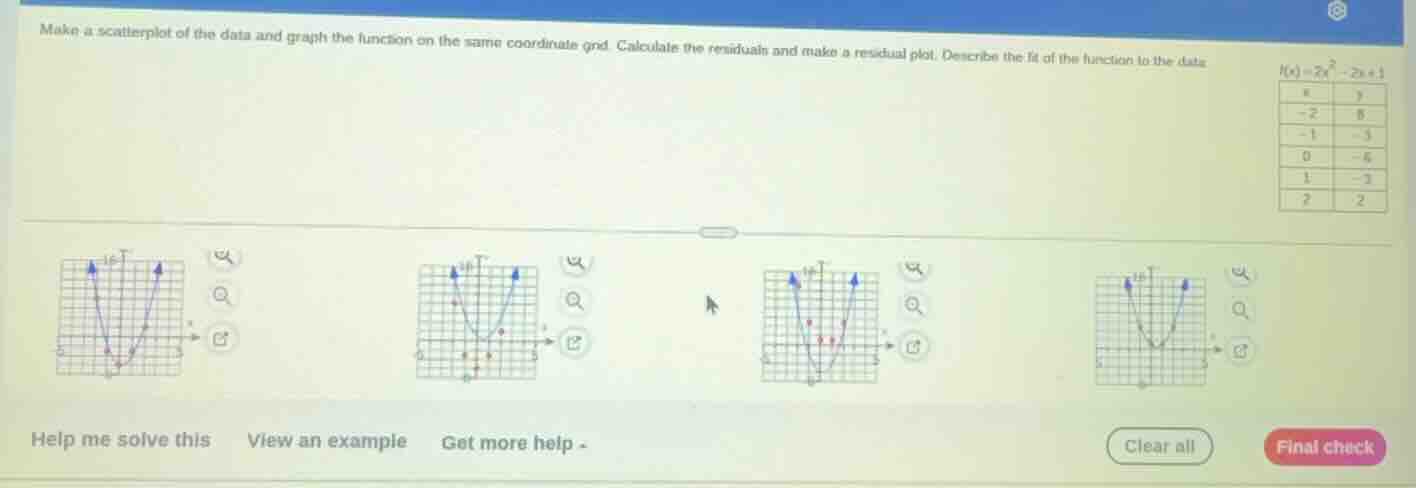
make a scatterplot of the data and graph the function on the same coordinate grid. calculate the residuals and make a residual plot. describe the fit of the function to the data.
$f(x)=3x^2 - 2x + 1$
| x | y |
| -2 | 8 |
| -1 | 3 |
| 0 | -6 |
| 1 | -2 |
| 2 | 2 |
Step1: Identify data points
Data points: $(-2,8), (-1,-3), (0,-6), (1,-3), (2,2)$
Step2: Calculate predicted values
For each $x$, compute $\hat{y}=2x^2-2x-6$:
- $x=-2$: $\hat{y}=2(-2)^2-2(-2)-6=8+4-6=8$
- $x=-1$: $\hat{y}=2(-1)^2-2(-1)-6=2+2-6=-3$
- $x=0$: $\hat{y}=2(0)^2-2(0)-6=0-0-6=-6$
- $x=1$: $\hat{y}=2(1)^2-2(1)-6=2-2-6=-3$
- $x=2$: $\hat{y}=2(2)^2-2(2)-6=8-4-6=2$
Step3: Compute residuals
Residual = $y-\hat{y}$ for each point:
- $8-8=0$, $-3-(-3)=0$, $-6-(-6)=0$, $-3-(-3)=0$, $2-2=0$
Step4: Evaluate function fit
All residuals are 0, so every data point lies exactly on the function.
Step5: Match to scatterplot
The middle-left graph plots all given data points correctly with the parabola passing through each point.

Snap & solve any problem in the app
Get step-by-step solutions on Sovi AI
Photo-based solutions with guided steps
Explore more problems and detailed explanations
- Correct scatterplot + function graph: The second graph (middle-left one with points (-2,8), (-1,-3), (0,-6), (1,-3), (2,2) plotted with the parabola $f(x)=2x^2-2x-6$)
- Residuals: $0, 0, 0, 0, 0$
- Residual plot: A horizontal line of points on the x-axis at x=-2,-1,0,1,2
- Fit description: Perfect fit