QUESTION IMAGE
Question
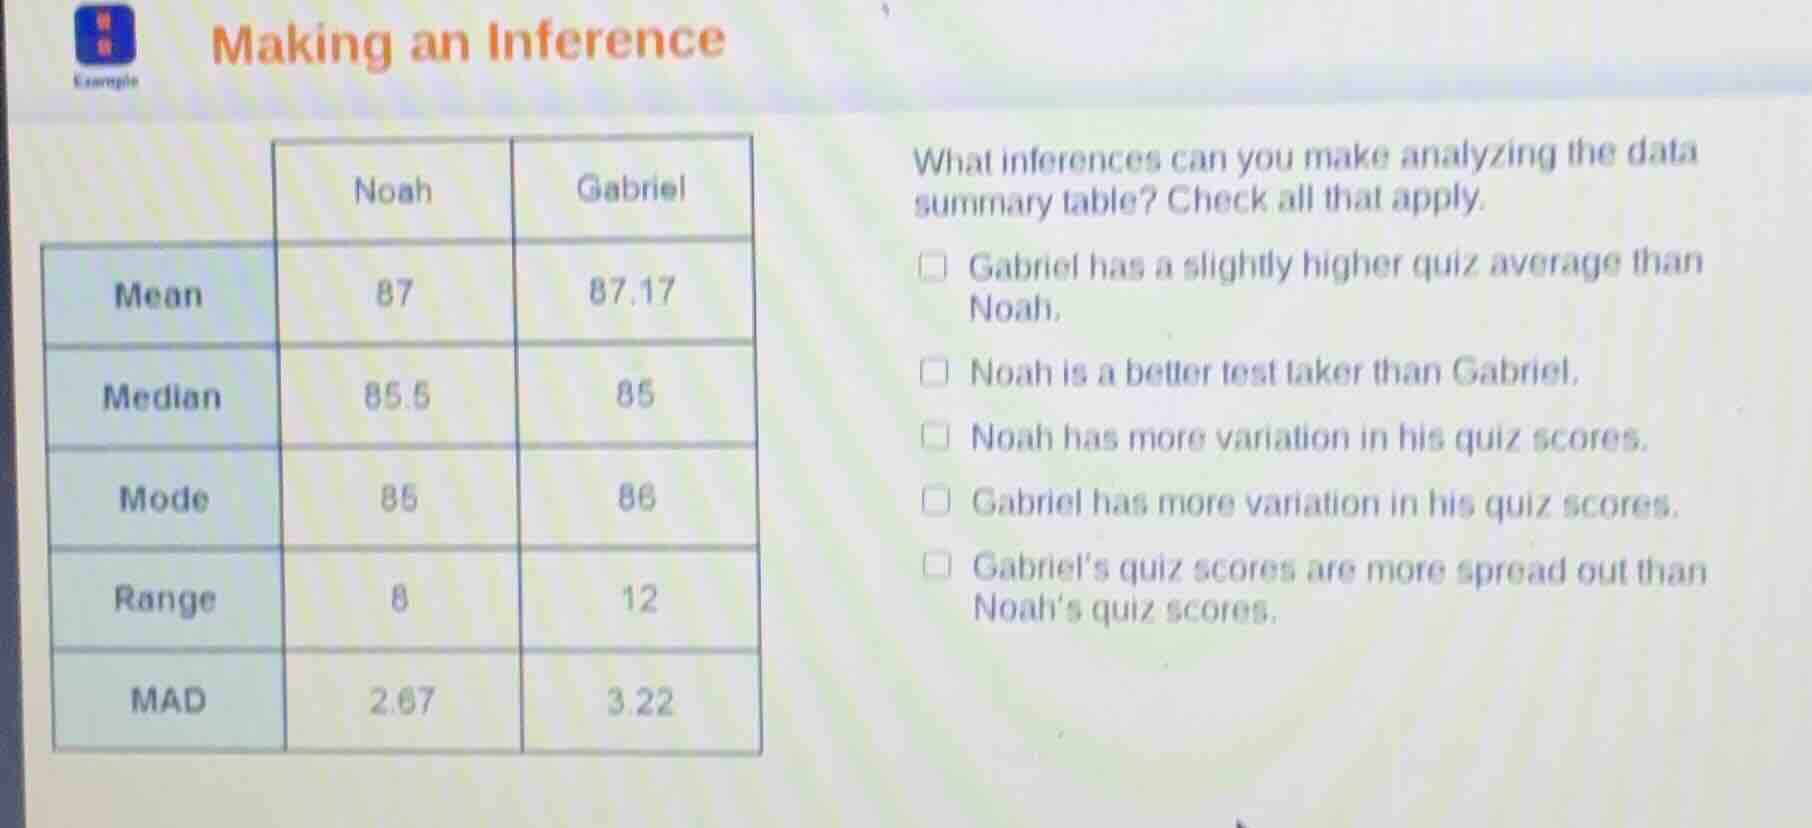
making an inference
what inferences can you make analyzing the data summary table? check all that apply.
□ gabriel has a slightly higher quiz average than noah.
□ noah is a better test taker than gabriel.
□ noah has more variation in his quiz scores.
□ gabriel has more variation in his quiz scores.
□ gabriels quiz scores are more spread out than noahs quiz scores.
Step1: Compare mean scores
Noah's mean = 87, Gabriel's mean = 87.17. $87.17 > 87$
Step2: Compare variation metrics
Noah's range = 8, MAD = 2.67; Gabriel's range = 12, MAD = 3.22. $12 > 8$, $3.22 > 2.67$
Step3: Evaluate unsupported claims
No data supports "better test taker" claim. Noah's variation is lower, not higher.

Snap & solve any problem in the app
Get step-by-step solutions on Sovi AI
Photo-based solutions with guided steps
Explore more problems and detailed explanations
Gabriel has a slightly higher quiz average than Noah.
Gabriel has more variation in his quiz scores.
Gabriel's quiz scores are more spread out than Noah's quiz scores.