QUESTION IMAGE
Question
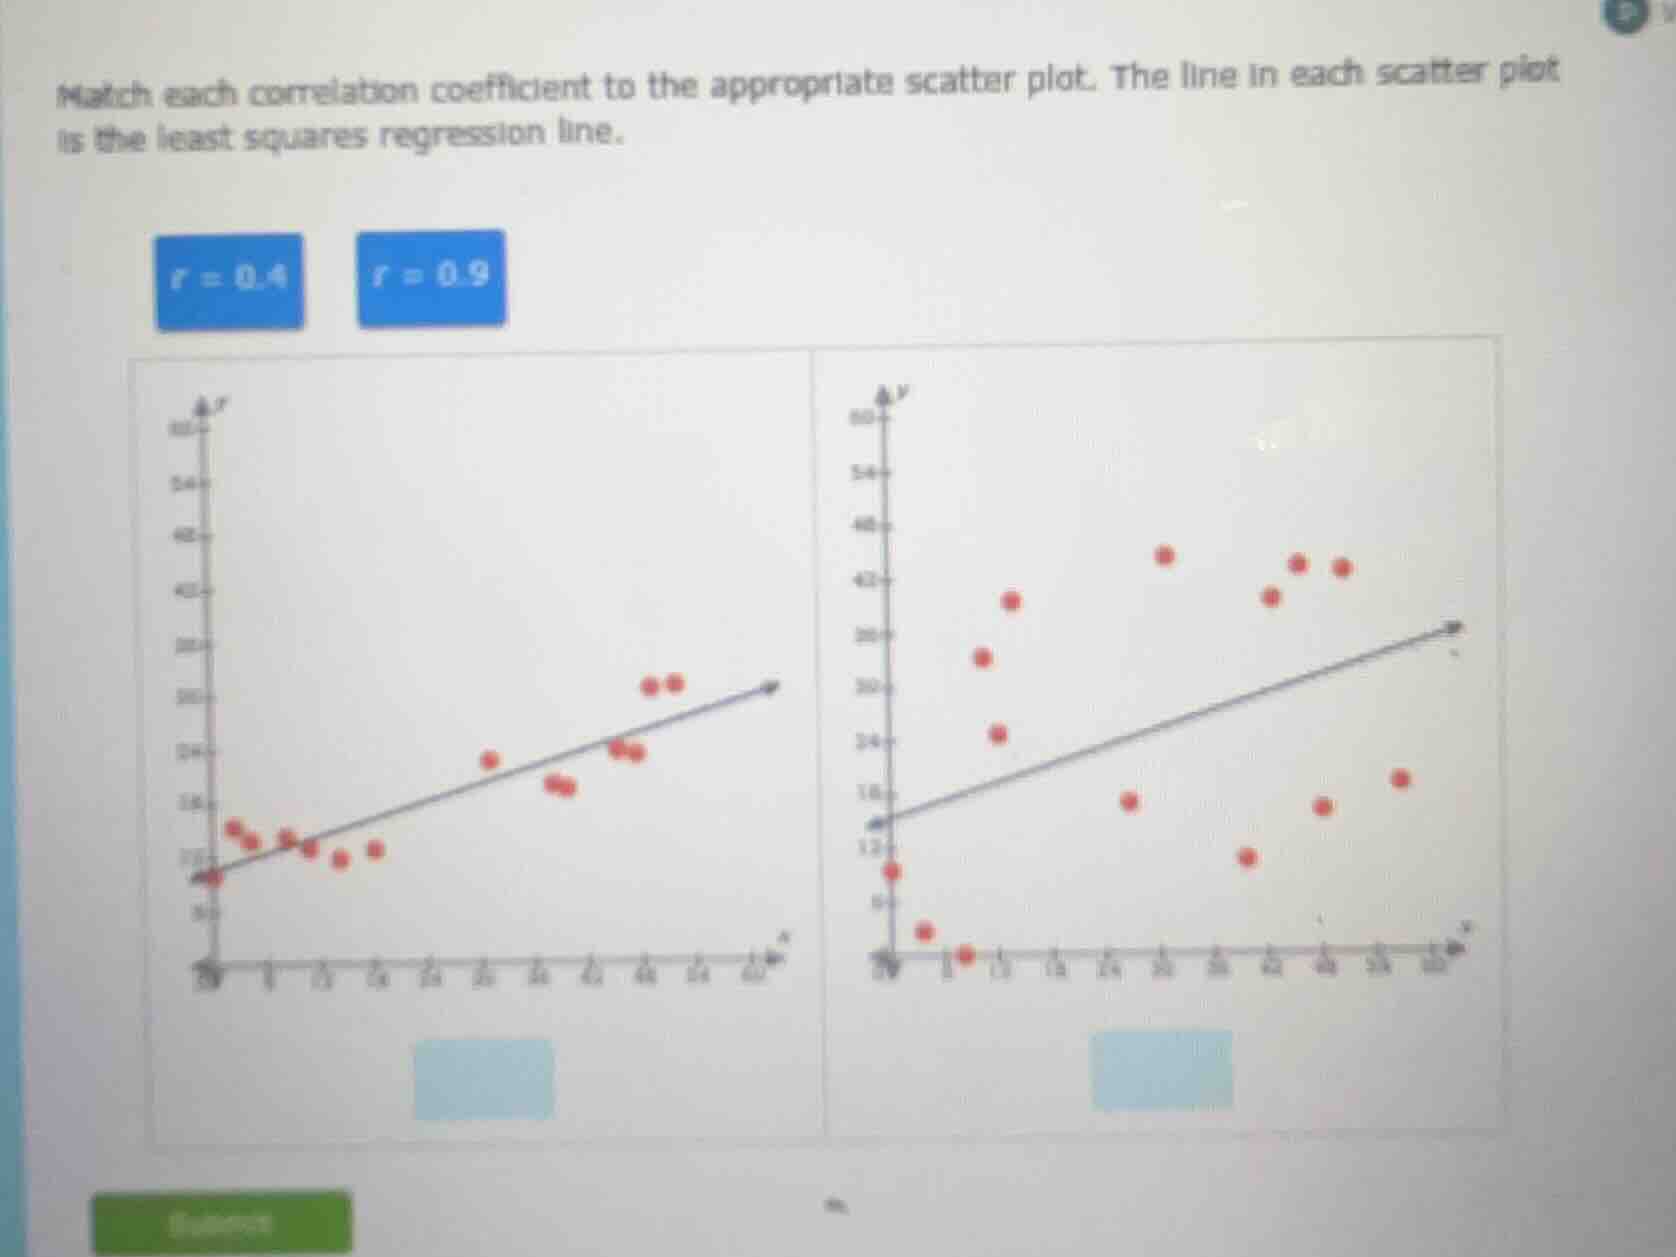
match each correlation coefficient to the appropriate scatter plot. the line in each scatter plot is the least squares regression line.
r = 0.4
r = 0.9
Step1: Recall correlation coefficient meaning
The correlation coefficient \( r \) measures the strength and direction of a linear relationship between two variables. A value closer to \( 1 \) (or \( -1 \)) indicates a stronger linear relationship, while a value closer to \( 0 \) indicates a weaker linear relationship.
Step2: Analyze scatter plot 1 (left)
The points in the left scatter plot are closer to the regression line, meaning the linear relationship is stronger. So this plot should correspond to \( r = 0.9 \) (since \( 0.9 \) is closer to \( 1 \) than \( 0.4 \)).
Step3: Analyze scatter plot 2 (right)
The points in the right scatter plot are more spread out from the regression line, meaning the linear relationship is weaker. So this plot should correspond to \( r = 0.4 \) (since \( 0.4 \) is closer to \( 0 \) than \( 0.9 \)).

Snap & solve any problem in the app
Get step-by-step solutions on Sovi AI
Photo-based solutions with guided steps
Explore more problems and detailed explanations
Left scatter plot: \( r = 0.9 \)
Right scatter plot: \( r = 0.4 \)