QUESTION IMAGE
Question
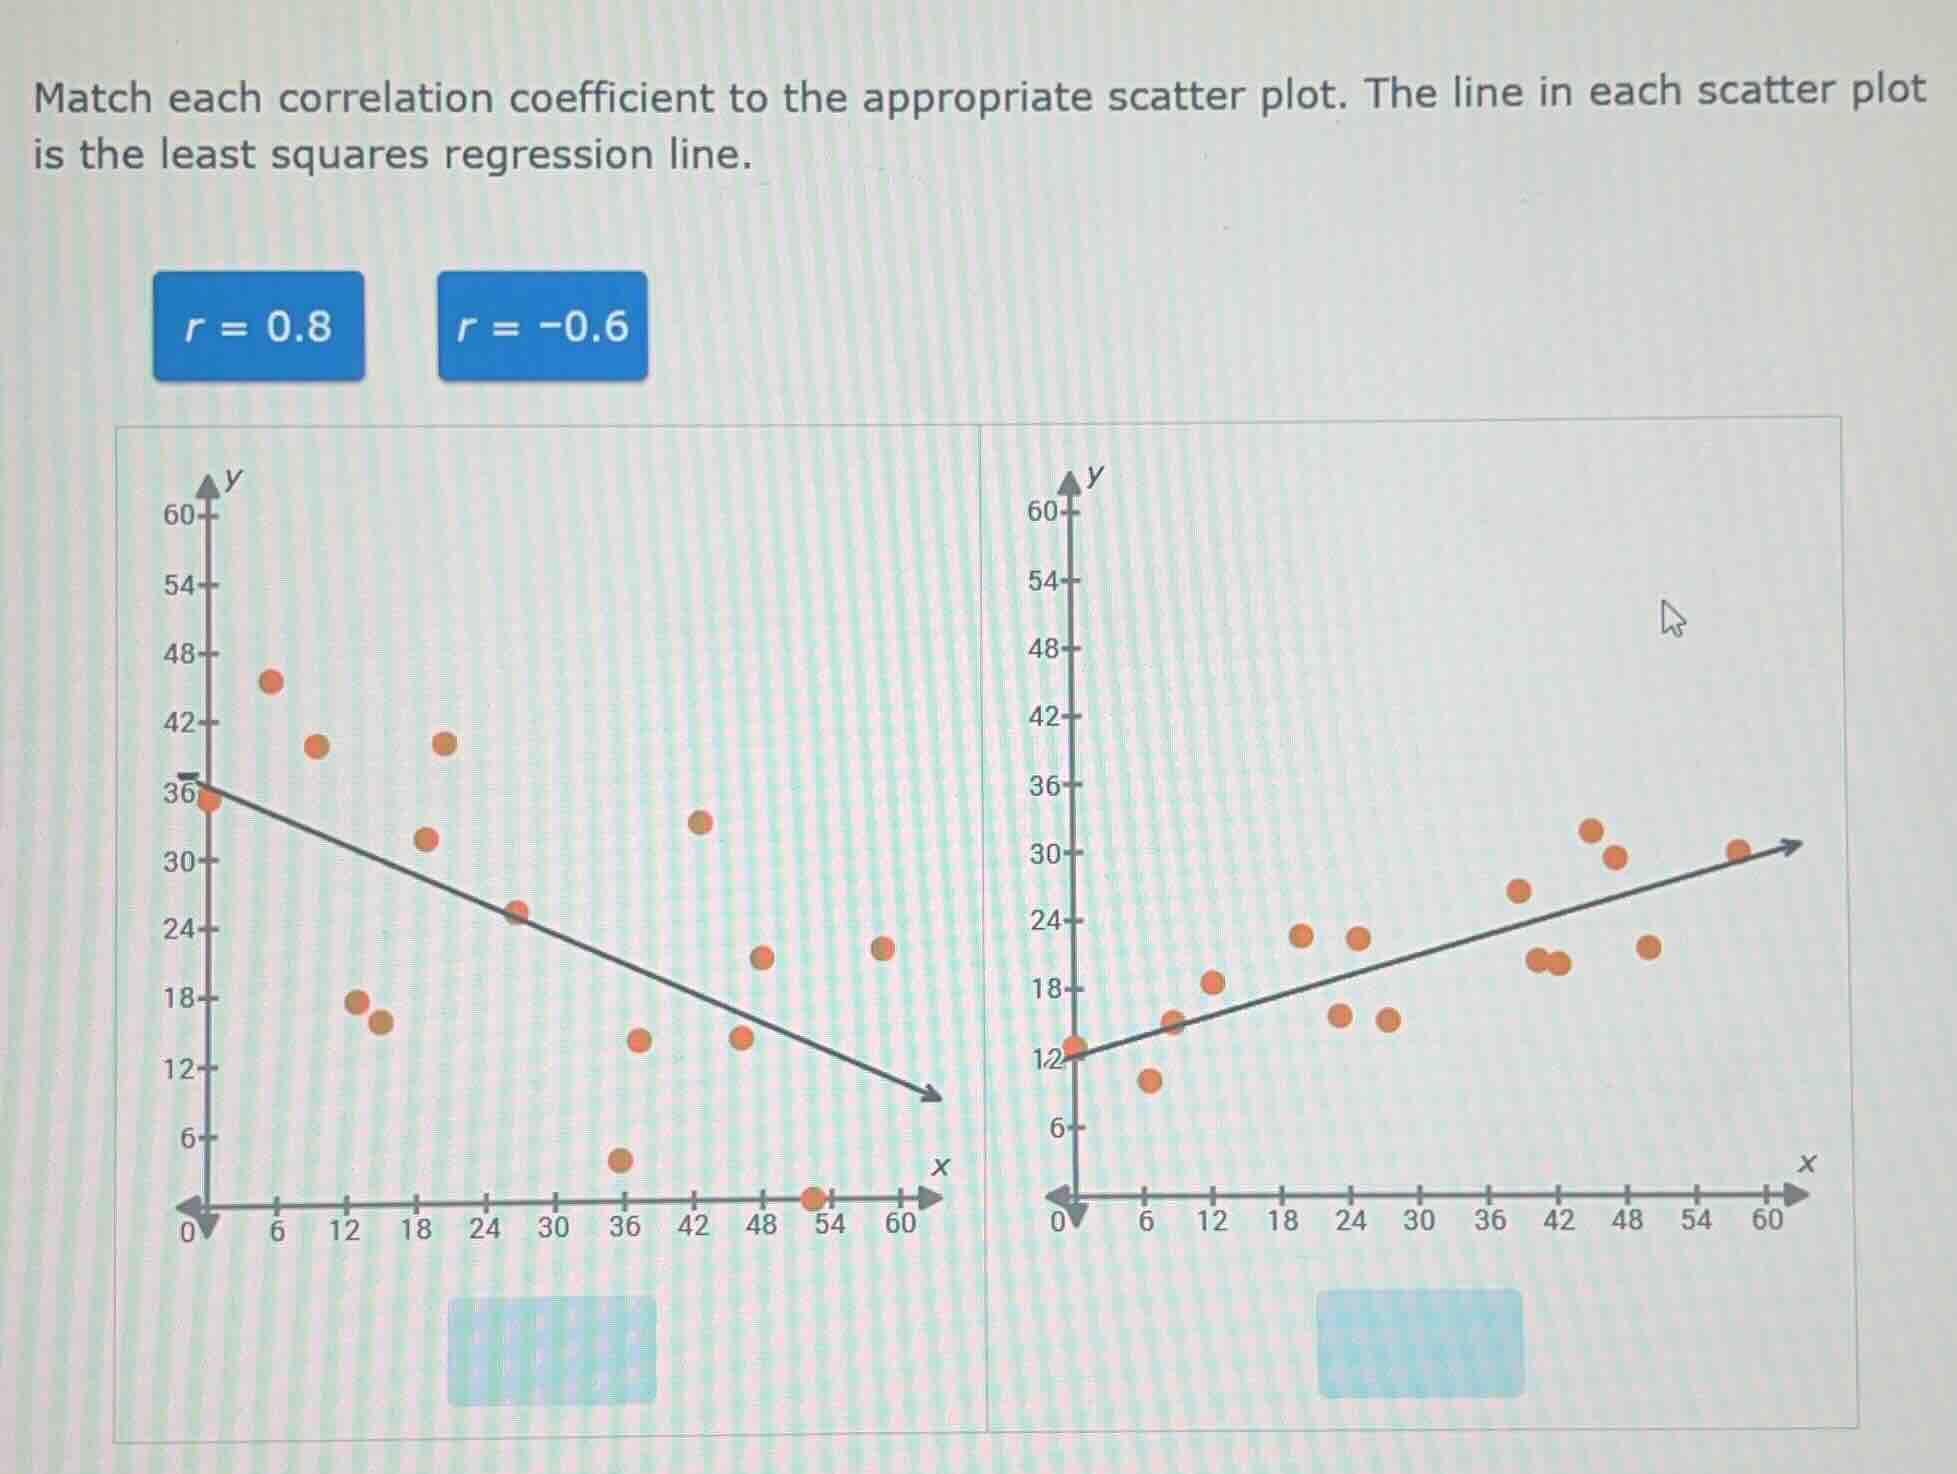
match each correlation coefficient to the appropriate scatter plot. the line in each scatter plot is the least squares regression line.
r = 0.8
r = -0.6
Step1: Identify slope direction
Left plot: negative slope; Right plot: positive slope.
Step2: Match sign of $r$
$r=-0.6$ (negative) → left plot; $r=0.8$ (positive) → right plot.
Step3: Verify correlation strength
$|0.8|>| -0.6|$, right plot points cluster tighter to the line, matching stronger correlation.

Snap & solve any problem in the app
Get step-by-step solutions on Sovi AI
Photo-based solutions with guided steps
Explore more problems and detailed explanations
Left scatter plot: $r = -0.6$
Right scatter plot: $r = 0.8$