QUESTION IMAGE
Question
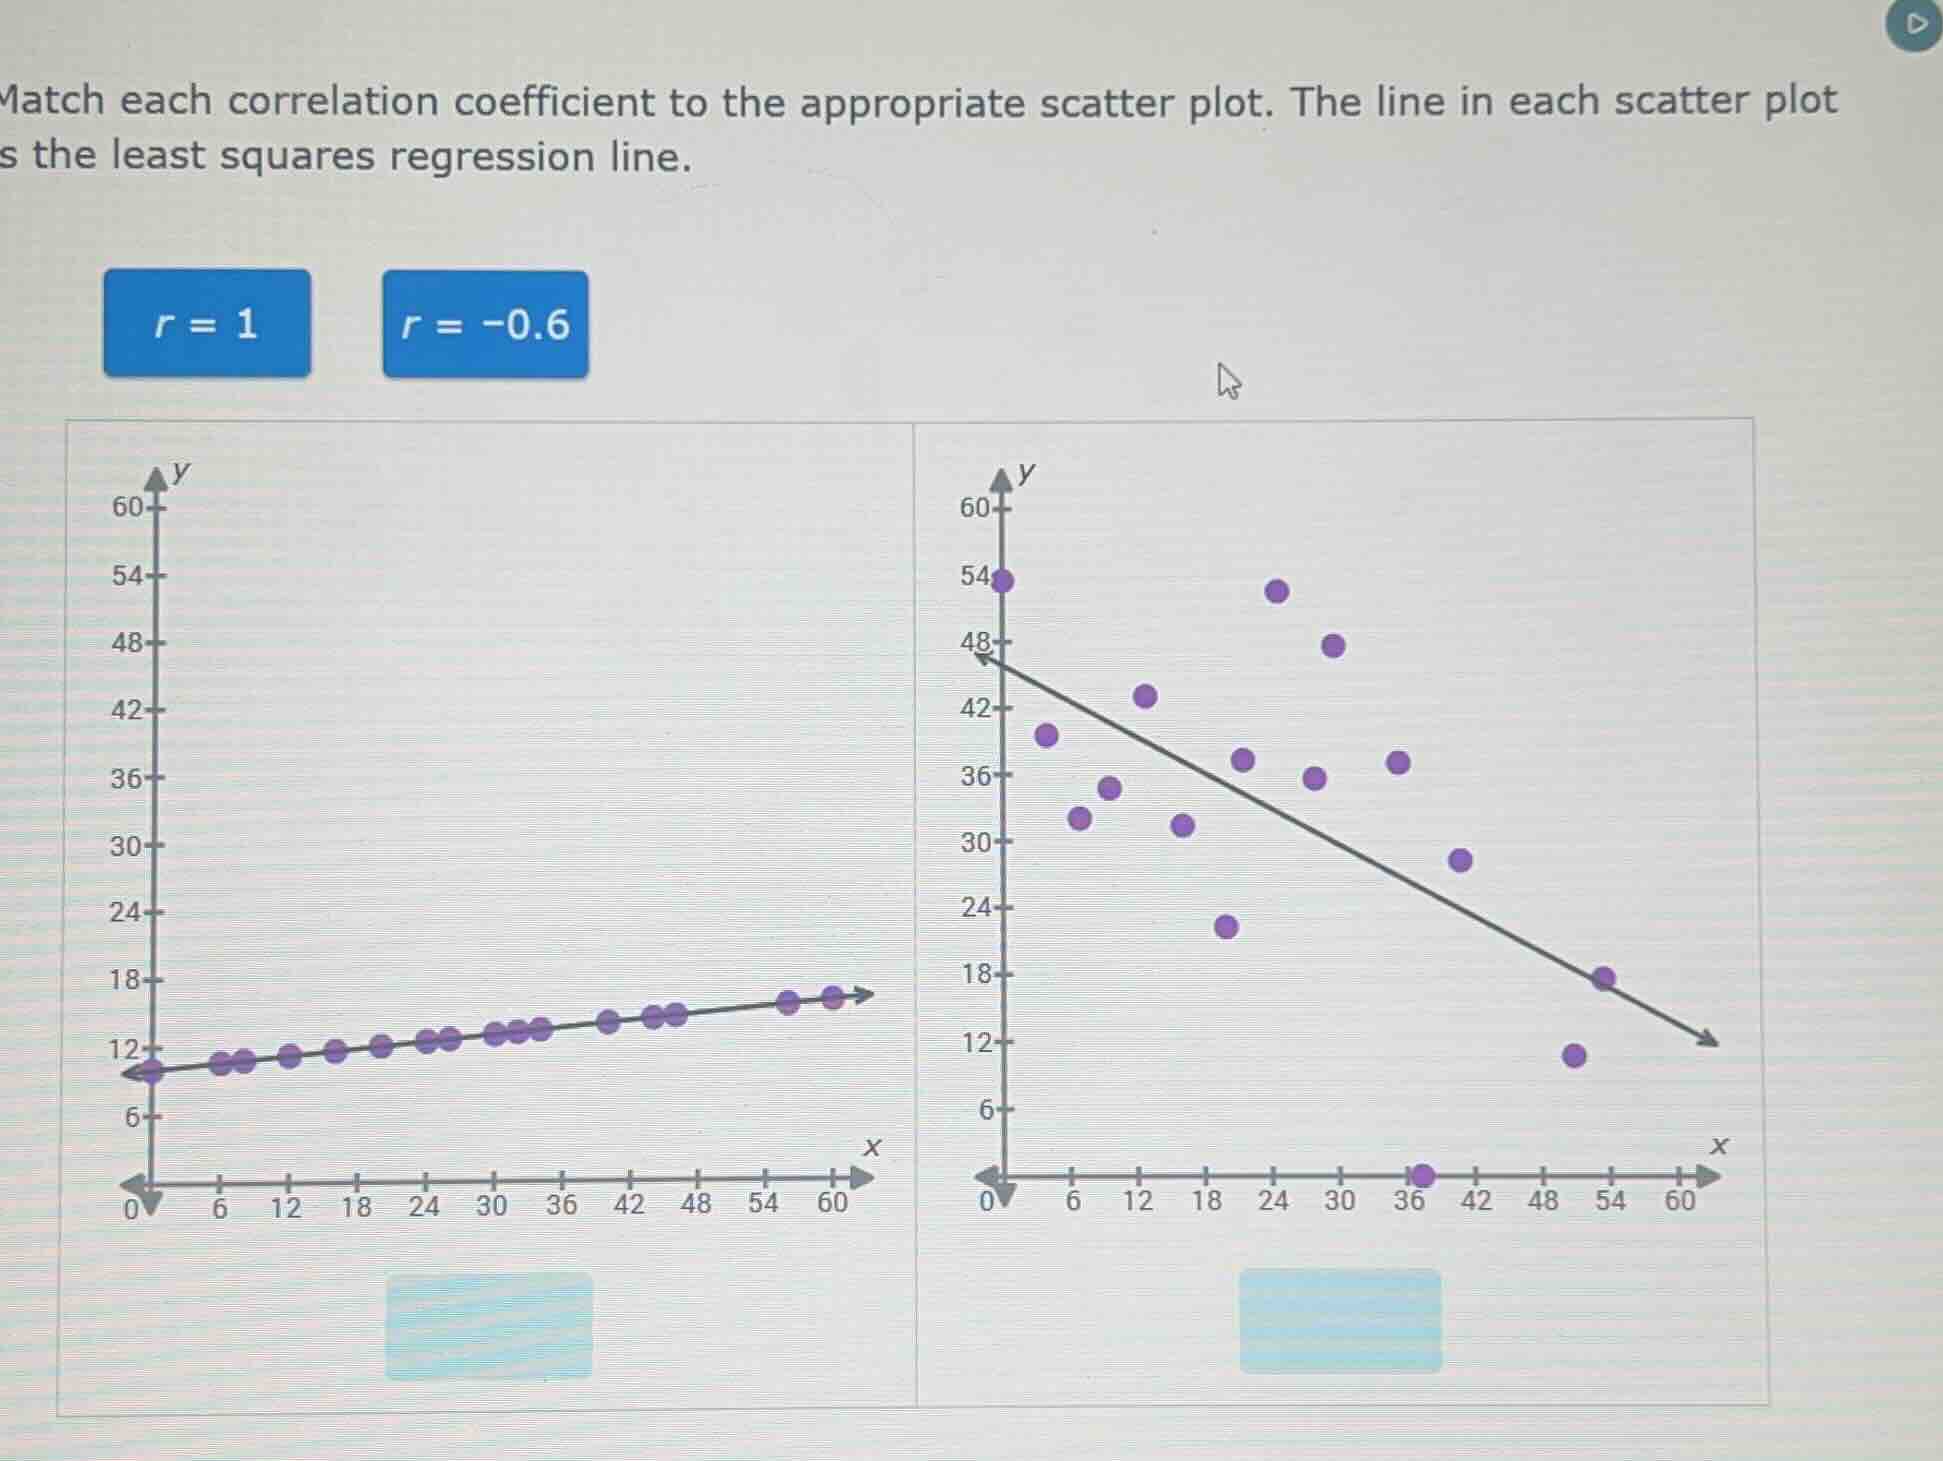
match each correlation coefficient to the appropriate scatter plot. the line in each scatter plot s the least squares regression line.
r = 1
r = -0.6
Brief Explanations
- For a correlation coefficient \(r = 1\), there is a perfect positive linear relationship: all data points lie exactly on an upward-sloping regression line. This matches the left scatter plot, where all points fall on the rising line.
- For a correlation coefficient \(r = -0.6\), there is a moderate negative linear relationship: the regression line slopes downward, and points are scattered around it (not perfectly aligned). This matches the right scatter plot, which has a downward-sloping line with scattered points.

Snap & solve any problem in the app
Get step-by-step solutions on Sovi AI
Photo-based solutions with guided steps
Explore more problems and detailed explanations
- Left scatter plot: \(r = 1\)
- Right scatter plot: \(r = -0.6\)