QUESTION IMAGE
Question
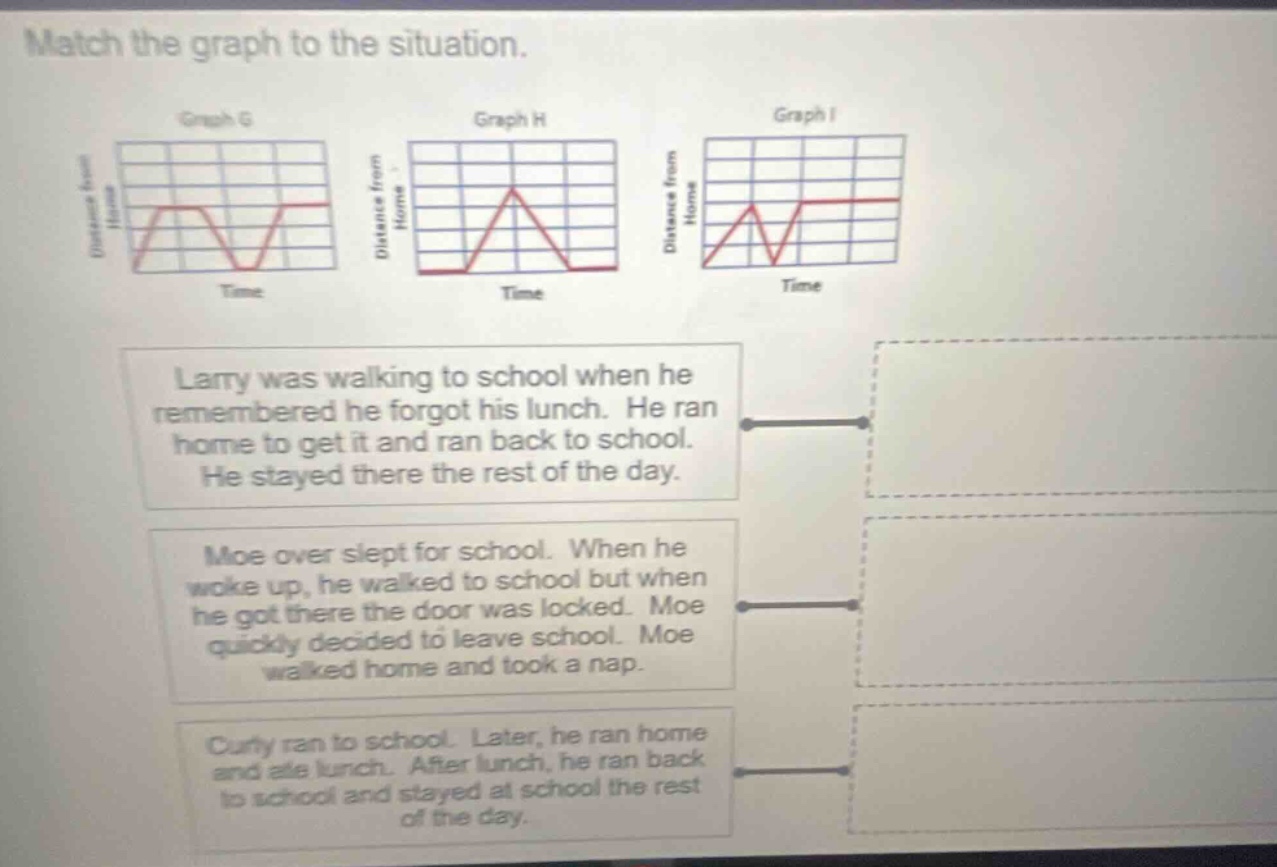
match the graph to the situation. graph g graph h graph i distance from home distance from home distance from home time time time larry was walking to school when he remembered he forgot his lunch. he ran home to get it and ran back to school. he stayed there the rest of the day. moe over slept for school. when he woke up, he walked to school but when he got there the door was locked. moe quickly decided to leave school. moe walked home and took a nap. curly ran to school. later, he ran home and ate lunch. after lunch, he ran back to school and stayed at school the rest of the day.
To solve this, we analyze each situation and match it to the graph by interpreting the distance - time relationship:
1. Analyze Larry's situation:
Larry walks to school (distance from home increases), then runs home (distance decreases to 0), then runs back to school (distance increases again) and stays (distance remains constant).
- Graph I: First, distance from home increases (walking to school), then decreases (running home), then increases again (running back to school) and then stays constant (staying at school). So Larry's situation matches Graph I.
2. Analyze Moe's situation:
Moe wakes up, walks to school (distance from home increases), then the school door is locked so he walks back home (distance decreases to 0) and takes a nap (distance remains 0).
- Graph H: Distance from home increases (walking to school), then decreases back to 0 (walking home) and then stays at 0 (taking a nap). So Moe's situation matches Graph H.
3. Analyze Curly's situation:
Curly runs to school (distance from home increases), then runs home (distance decreases), then runs back to school (distance increases) and stays at school (distance remains constant). But there is also a period where he is at school initially? Wait, no - Curly runs to school (distance up), then home (distance down), then back to school (distance up) and stays. Wait, Graph G: Let's re - check. Curly runs to school (distance increases), then home (distance decreases), then back to school (distance increases) and then stays? Wait, no, the first part of Graph G: distance increases (to school), then stays (maybe at school?), then decreases (home), then increases (back to school) and stays. Wait, maybe I made a mistake earlier. Wait, Curly's situation: runs to school (distance up), then home (distance down), then back to school (distance up) and stays. But the description says "ran to school. Later, he ran home and ate lunch. After lunch, he ran back to school and stayed at school the rest of the day." So first, distance to school (up), then home (down), then back to school (up) and stay. Wait, Graph G: Let's see the shape. Graph G has a peak (school), then a valley (home), then a peak (school) and then stays. So Curly's situation: runs to school (first peak), then home (valley), then back to school (second peak) and stays. So Curly's situation matches Graph G.
Final Matches:
- Larry: Graph I
- Moe: Graph H
- Curly: Graph G
If we assume the left - hand side is the situation and the right - hand side is the graph (the dotted boxes are the graphs), then:
- "Larry was walking to school when he remembered he forgot his lunch. He ran home to get it and ran back to school. He stayed there the rest of the day." → Graph I
- "Moe over slept for school. When he woke up, he walked to school but when he got there the door was locked. Moe quickly decided to leave school. Moe walked home and took a nap." → Graph H
- "Curly ran to school. Later, he ran home and ate lunch. After lunch, he ran back to school and stayed at school the rest of the day." → Graph G

Snap & solve any problem in the app
Get step-by-step solutions on Sovi AI
Photo-based solutions with guided steps
Explore more problems and detailed explanations
To solve this, we analyze each situation and match it to the graph by interpreting the distance - time relationship:
1. Analyze Larry's situation:
Larry walks to school (distance from home increases), then runs home (distance decreases to 0), then runs back to school (distance increases again) and stays (distance remains constant).
- Graph I: First, distance from home increases (walking to school), then decreases (running home), then increases again (running back to school) and then stays constant (staying at school). So Larry's situation matches Graph I.
2. Analyze Moe's situation:
Moe wakes up, walks to school (distance from home increases), then the school door is locked so he walks back home (distance decreases to 0) and takes a nap (distance remains 0).
- Graph H: Distance from home increases (walking to school), then decreases back to 0 (walking home) and then stays at 0 (taking a nap). So Moe's situation matches Graph H.
3. Analyze Curly's situation:
Curly runs to school (distance from home increases), then runs home (distance decreases), then runs back to school (distance increases) and stays at school (distance remains constant). But there is also a period where he is at school initially? Wait, no - Curly runs to school (distance up), then home (distance down), then back to school (distance up) and stays. Wait, Graph G: Let's re - check. Curly runs to school (distance increases), then home (distance decreases), then back to school (distance increases) and then stays? Wait, no, the first part of Graph G: distance increases (to school), then stays (maybe at school?), then decreases (home), then increases (back to school) and stays. Wait, maybe I made a mistake earlier. Wait, Curly's situation: runs to school (distance up), then home (distance down), then back to school (distance up) and stays. But the description says "ran to school. Later, he ran home and ate lunch. After lunch, he ran back to school and stayed at school the rest of the day." So first, distance to school (up), then home (down), then back to school (up) and stay. Wait, Graph G: Let's see the shape. Graph G has a peak (school), then a valley (home), then a peak (school) and then stays. So Curly's situation: runs to school (first peak), then home (valley), then back to school (second peak) and stays. So Curly's situation matches Graph G.
Final Matches:
- Larry: Graph I
- Moe: Graph H
- Curly: Graph G
If we assume the left - hand side is the situation and the right - hand side is the graph (the dotted boxes are the graphs), then:
- "Larry was walking to school when he remembered he forgot his lunch. He ran home to get it and ran back to school. He stayed there the rest of the day." → Graph I
- "Moe over slept for school. When he woke up, he walked to school but when he got there the door was locked. Moe quickly decided to leave school. Moe walked home and took a nap." → Graph H
- "Curly ran to school. Later, he ran home and ate lunch. After lunch, he ran back to school and stayed at school the rest of the day." → Graph G