QUESTION IMAGE
Question
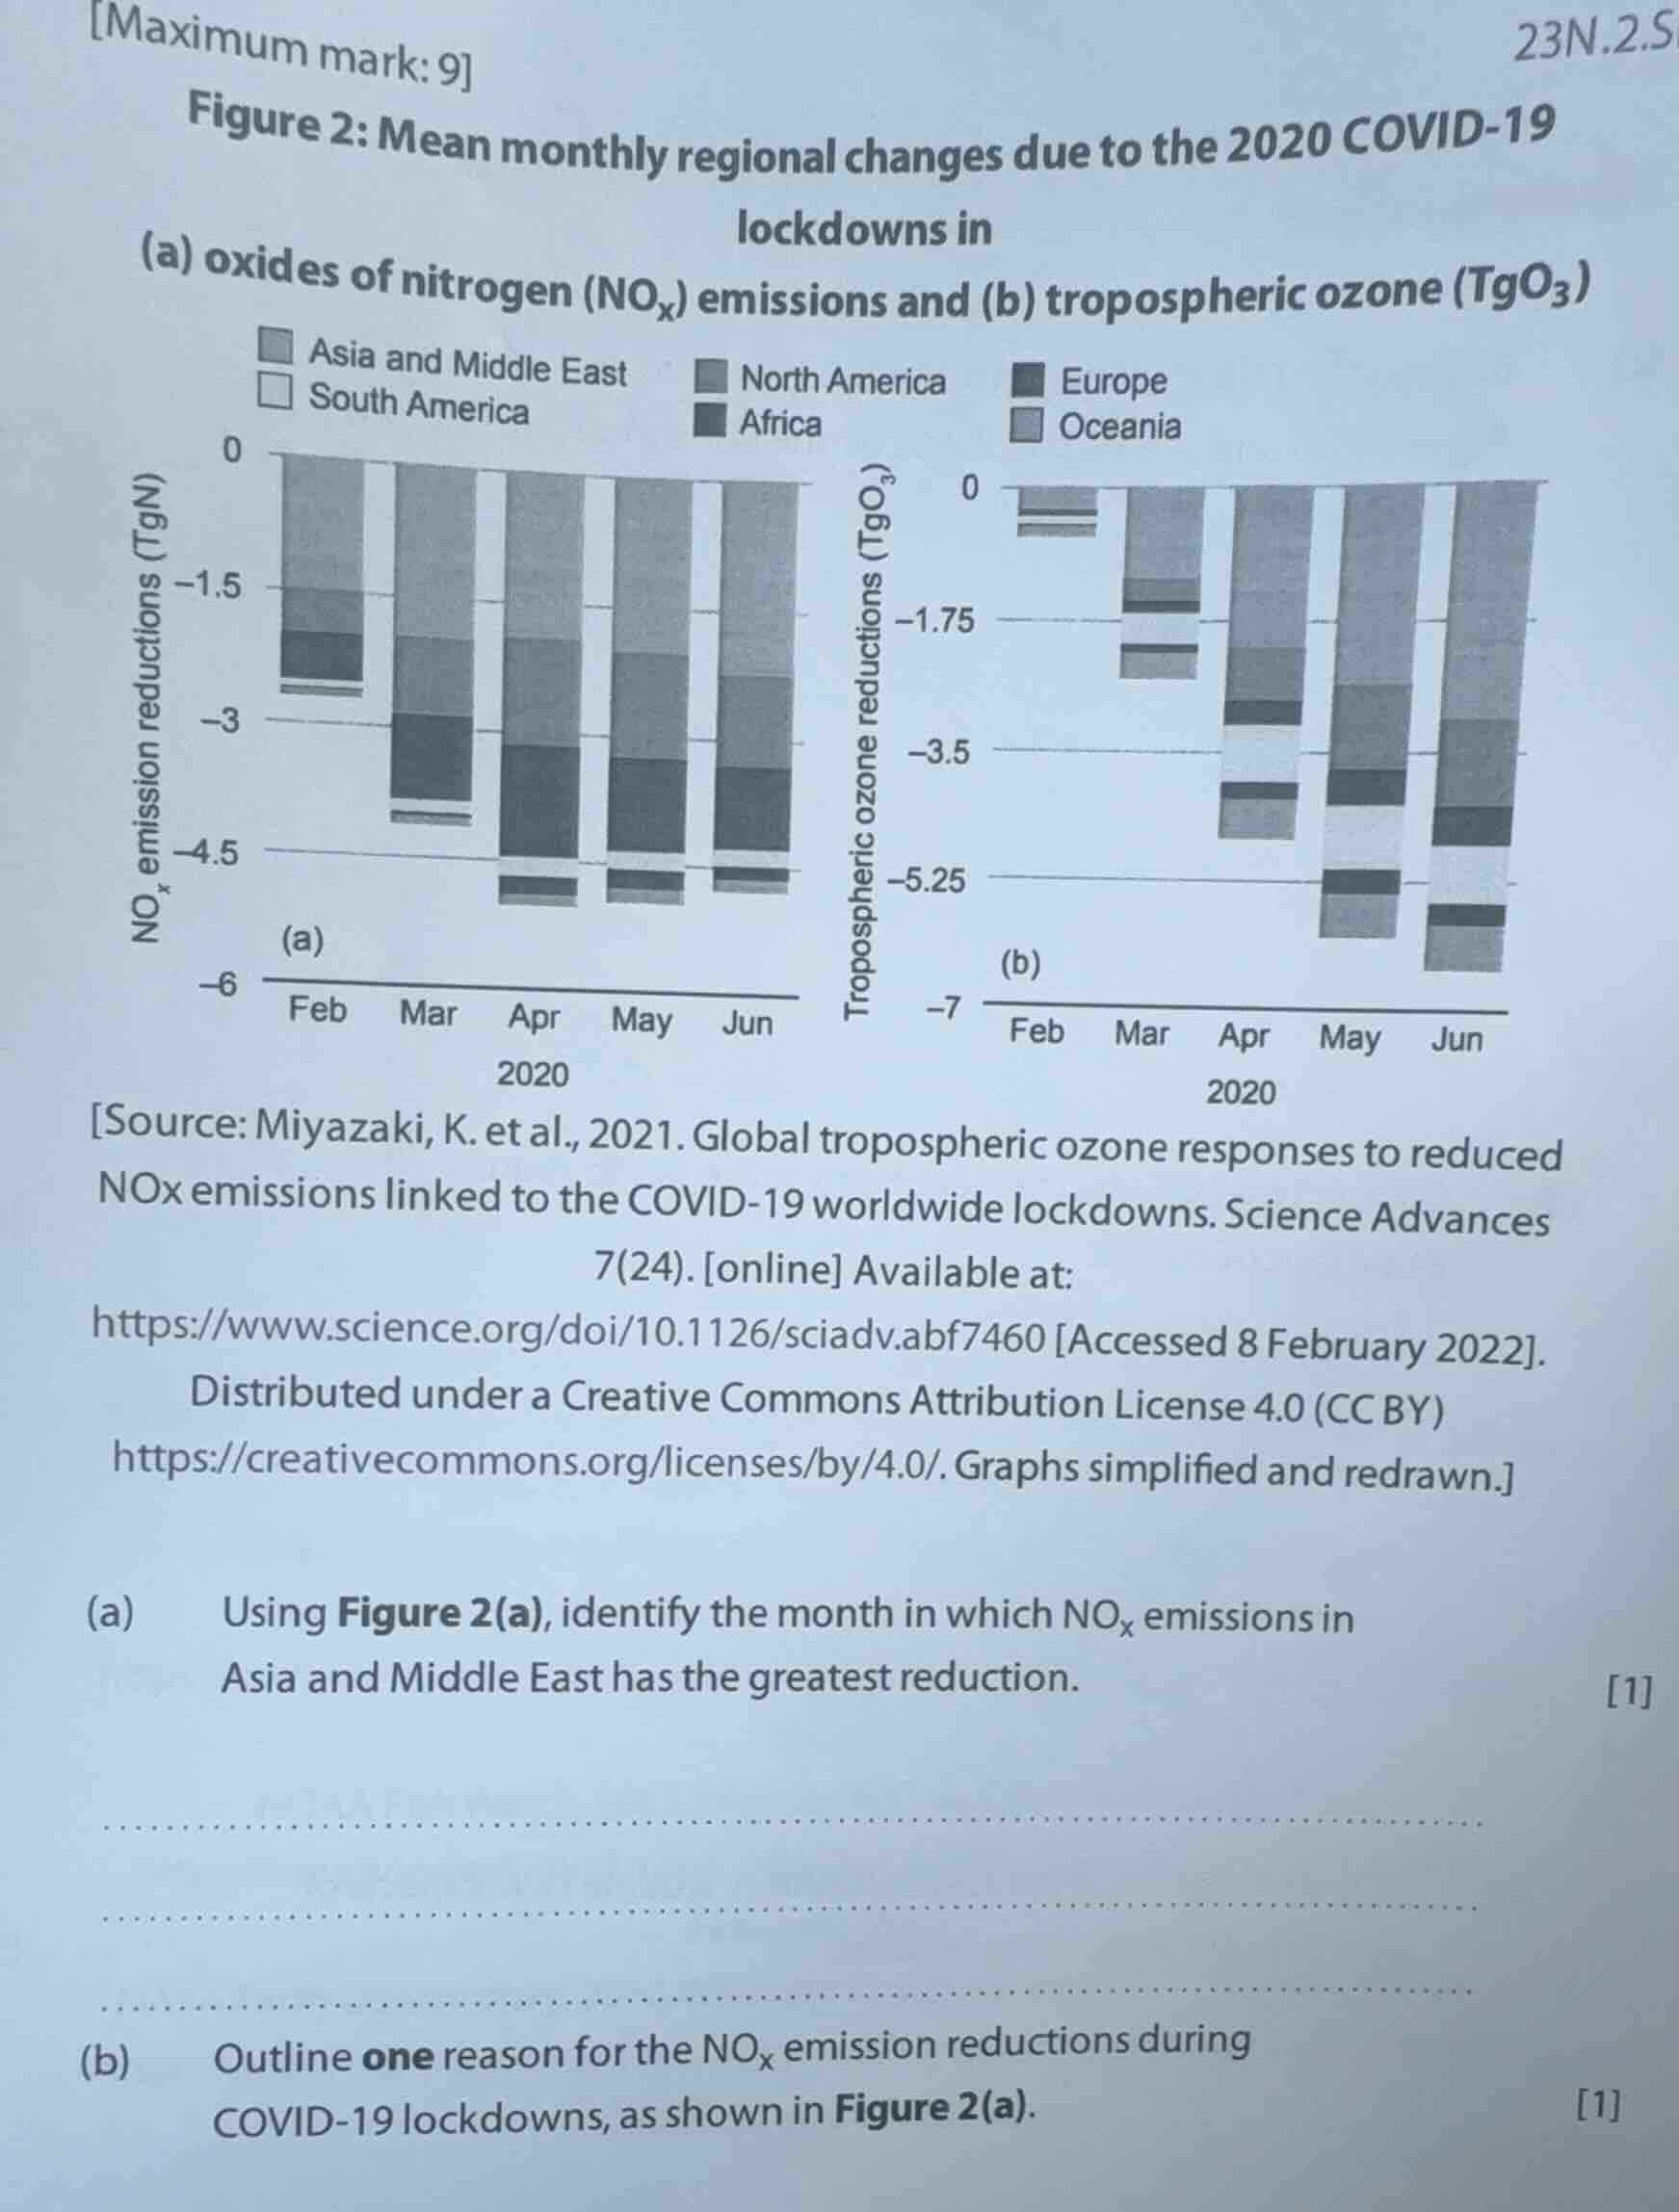
maximum mark: 9
23n.2.s
figure 2: mean monthly regional changes due to the 2020 covid-19 lockdowns in
(a) oxides of nitrogen (noₓ) emissions and (b) tropospheric ozone (tgo₃)
asia and middle east
north america
europe
south america
africa
oceania
source: miyazaki, k. et al., 2021. global tropospheric ozone responses to reduced nox emissions linked to the covid-19 worldwide lockdowns. science advances 7(24). online available at:
https://www.science.org/doi/10.1126/sciadv.abf7460 accessed 8 february 2022.
distributed under a creative commons attribution license 4.0 (cc by)
https://creativecommons.org/licenses/by/4.0/. graphs simplified and redrawn.
(a) using figure 2(a), identify the month in which noₓ emissions in asia and middle east has the greatest reduction. 1
(b) outline one reason for the noₓ emission reductions during covid-19 lockdowns, as shown in figure 2(a). 1
(a) By examining Figure 2(a), the segment representing Asia and Middle East for NOₓ emission reductions is the longest (closest to -6 TgN) in April 2020, indicating the greatest reduction.
(b) COVID-19 lockdowns imposed strict travel restrictions and reduced industrial activity, leading to a sharp drop in the use of fossil fuel-powered vehicles and machinery, which are major sources of NOₓ emissions.

Snap & solve any problem in the app
Get step-by-step solutions on Sovi AI
Photo-based solutions with guided steps
Explore more problems and detailed explanations
(a) April 2020
(b) COVID-19 lockdowns reduced road traffic and industrial operations, which are key sources of NOₓ emissions, leading to lower emissions.