QUESTION IMAGE
Question
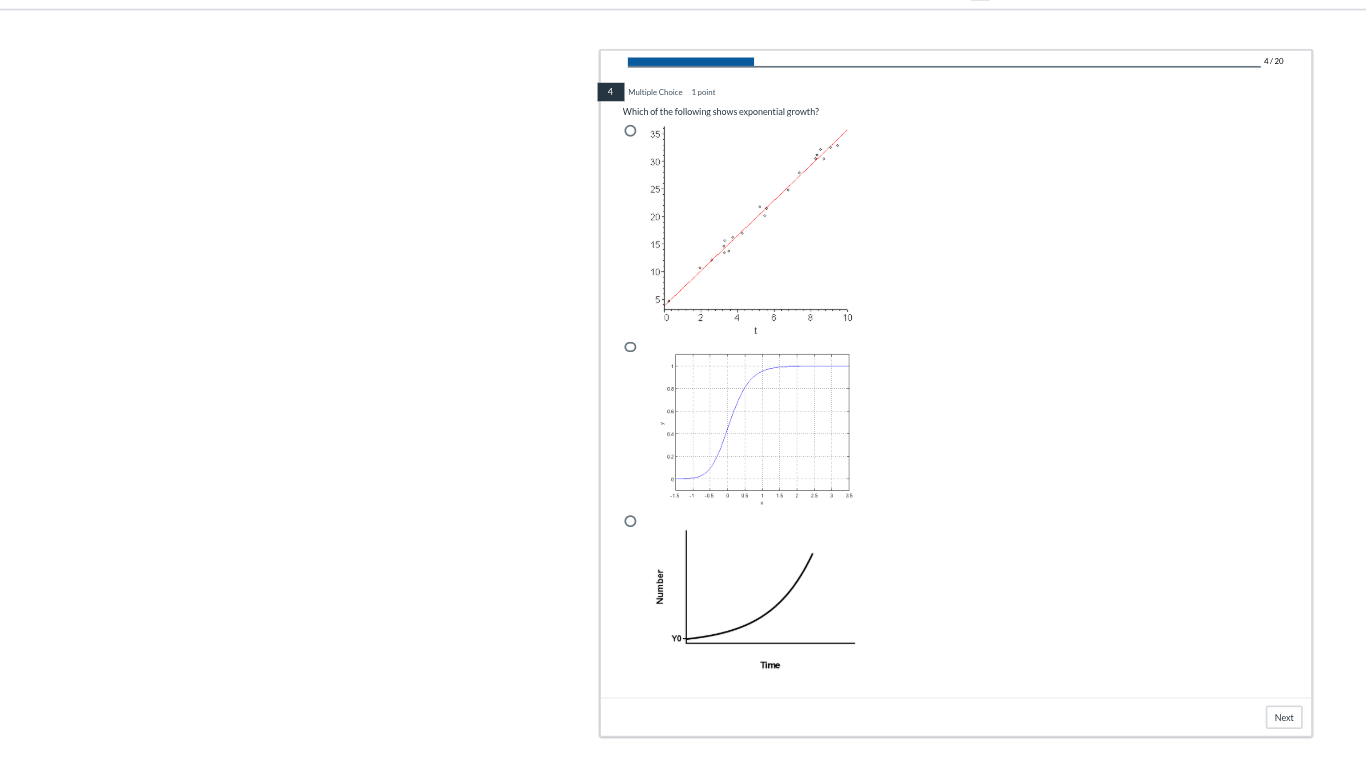
4 multiple choice 1 point which of the following shows exponential growth? (images of graphs are present for the options)
To determine which graph shows exponential growth, we recall the characteristics of exponential growth functions. An exponential growth function has the form \( y = a \cdot b^x \) where \( a>0 \) and \( b > 1 \), and its graph is a curve that increases rapidly (the slope gets steeper over time) and passes through the point \( (0,a) \) (when \( x = 0 \), \( y=a \)).
- The first graph is a straight line, which represents a linear function (e.g., \( y=mx + c \)), not exponential. Linear functions have a constant slope, while exponential functions have a changing (increasing) slope.
- The second graph appears to be a logistic growth curve (it has a period of slow growth, then rapid growth, then saturation), which is not pure exponential growth.
- The third graph (with "Number" on the y - axis and "Time" on the x - axis) shows a curve that starts at a positive value ( \( y_0 \) when \( t = 0 \)) and increases with an increasing slope, which is characteristic of an exponential growth curve (since the rate of growth is proportional to the current quantity, leading to the curve getting steeper as time increases).

Snap & solve any problem in the app
Get step-by-step solutions on Sovi AI
Photo-based solutions with guided steps
Explore more problems and detailed explanations
The third graph (the one with "Number" on the y - axis and "Time" on the x - axis, showing a curve that starts at \( y_0 \) and gets steeper as time increases)